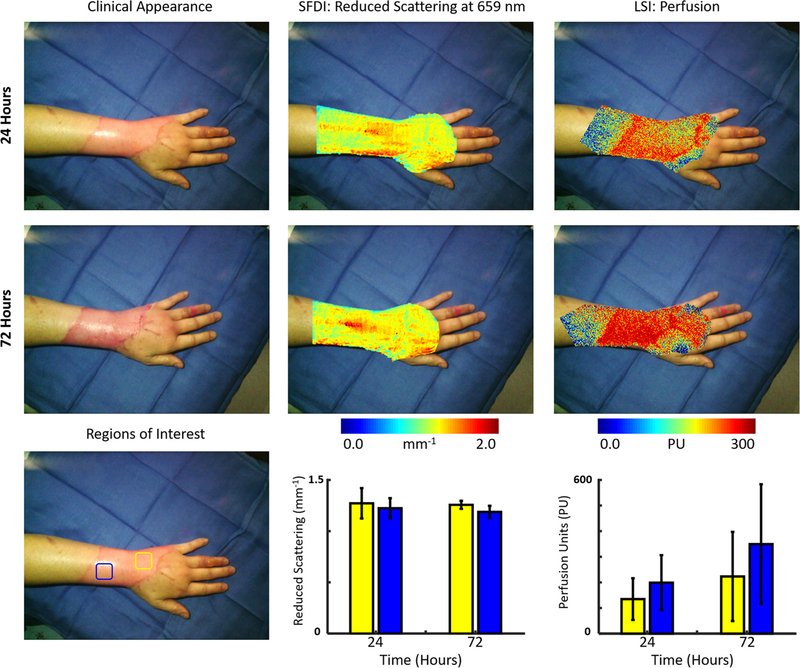
Fig. 3.
(Top row, left to right) Case 3. The clinical appearance, SFDI derived reduced scattering image and LSI derived perfusion image obtained at 24 h. (Middle row, left to right) The clinical appearance, SFDI derived reduced scattering image and LSI derived perfusion image obtained at 72 h. (Bottom row) Average SFDI and LSI values at 24 and 72 h post-burn in two regions (blue and yellow). (For interpretation of the references to colour in this figure legend, the reader is referred to the web version of this article.)

