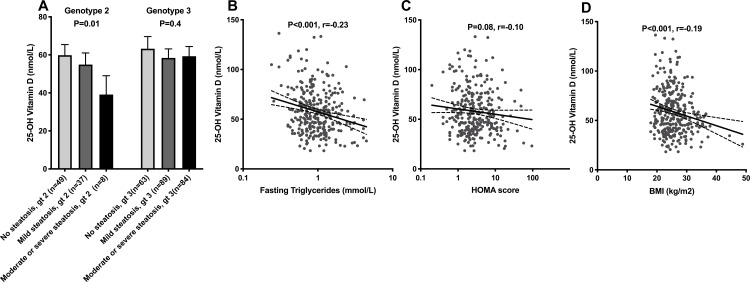
Fig 3. 25-hydroxy vitamin D and liver steatosis.
Bar chart for 25-hydroxy vitamin D and liver steatosis severity is shown for the different hepatitis C virus genotypes (A). Also scatter plots for 25-hydroxy vitamin D and fasting triglycerides (B), HOMA-score (C) and BMI (D) are shown. Mean concentration and 95% confidence interval is shown. Statistical significance determined by One Way ANOVA and Pearson’s test.

