Fig. 7.

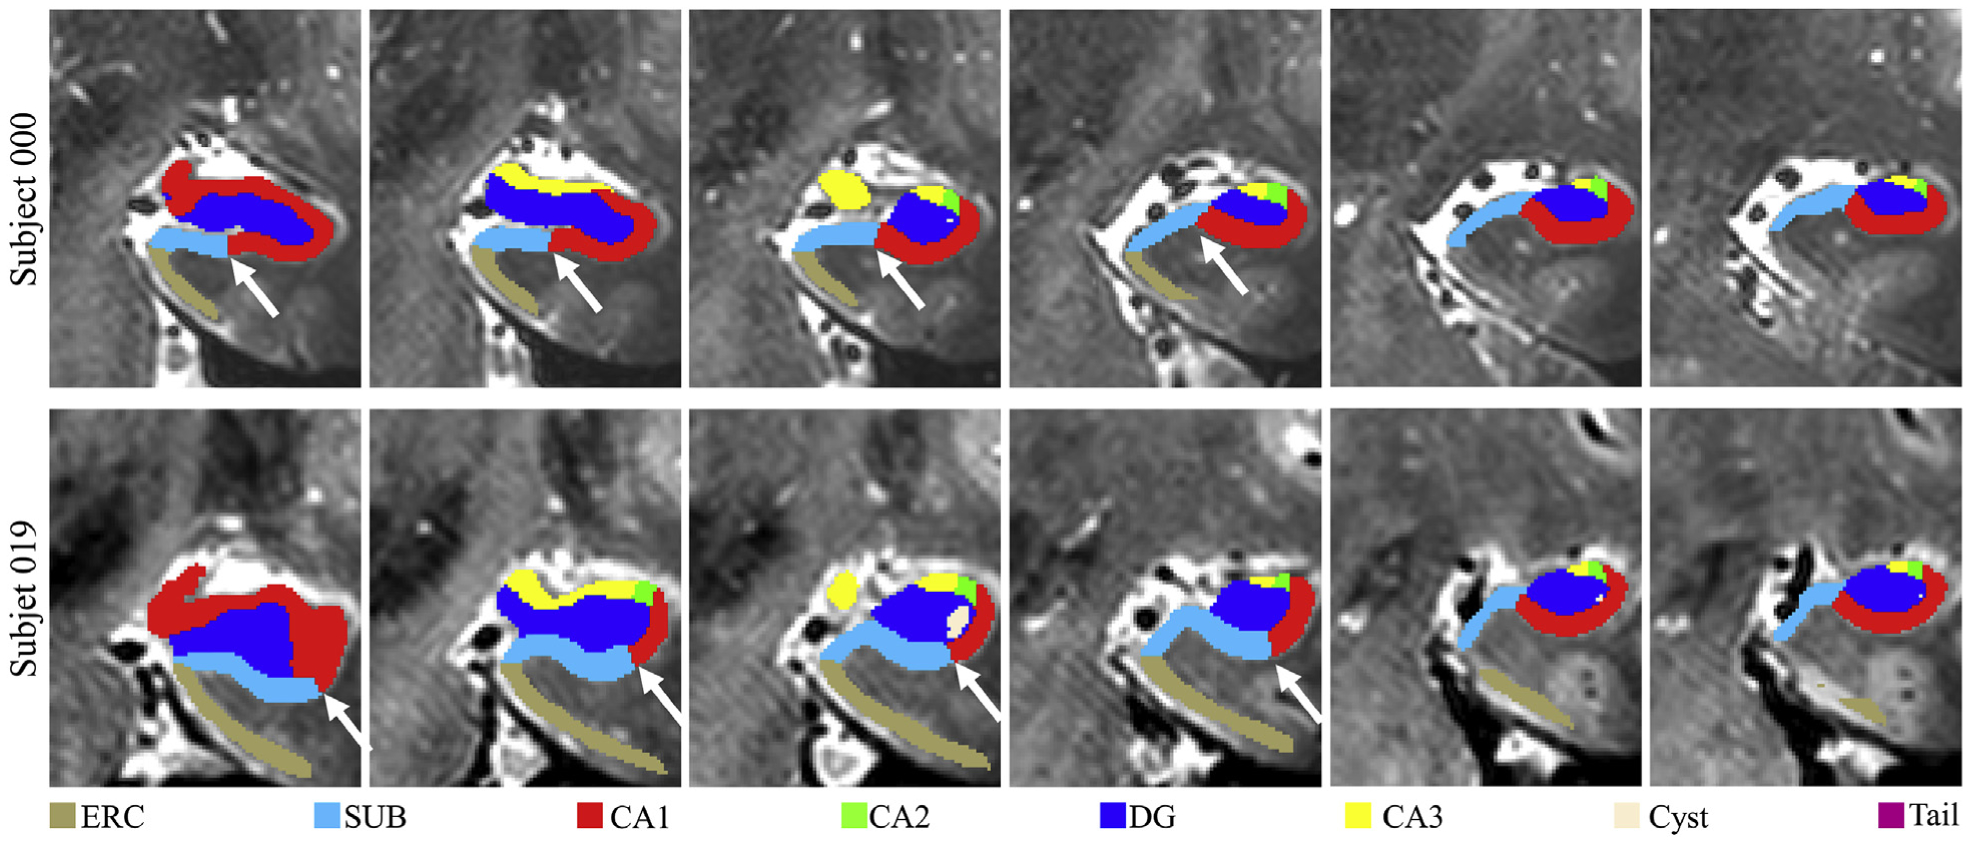
Example plots of the boundary between CA1 and SUB varying across subjects in UMC dataset. The white arrows point to the distinct boundary between CA1 and SUB in two subjects.

Example plots of the boundary between CA1 and SUB varying across subjects in UMC dataset. The white arrows point to the distinct boundary between CA1 and SUB in two subjects.