
Fig. 5.
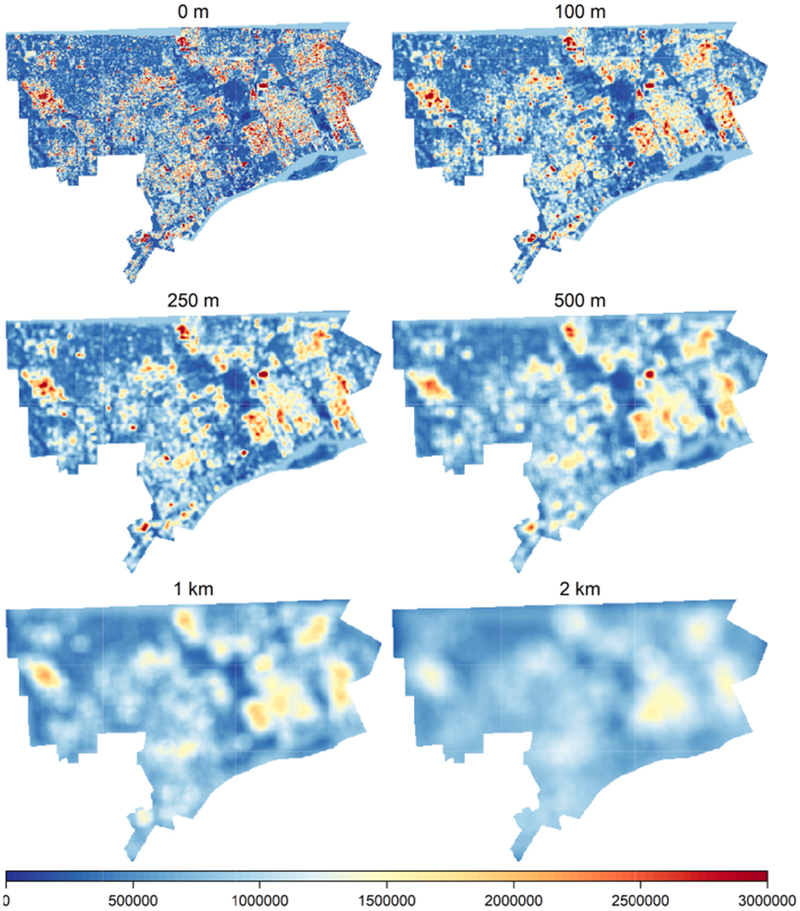
Maps of predicted ragweed pollen production (pollen per m2) across Detroit in 2016 and 2017 averaged at various radii around each cell.
Official websites use .gov
A
.gov website belongs to an official
government organization in the United States.
Secure .gov websites use HTTPS
A lock (
) or https:// means you've safely
connected to the .gov website. Share sensitive
information only on official, secure websites.
Maps of predicted ragweed pollen production (pollen per m2) across Detroit in 2016 and 2017 averaged at various radii around each cell.