. 2019 Nov 15;11(2):355–363. doi: 10.1039/c9sc04670d

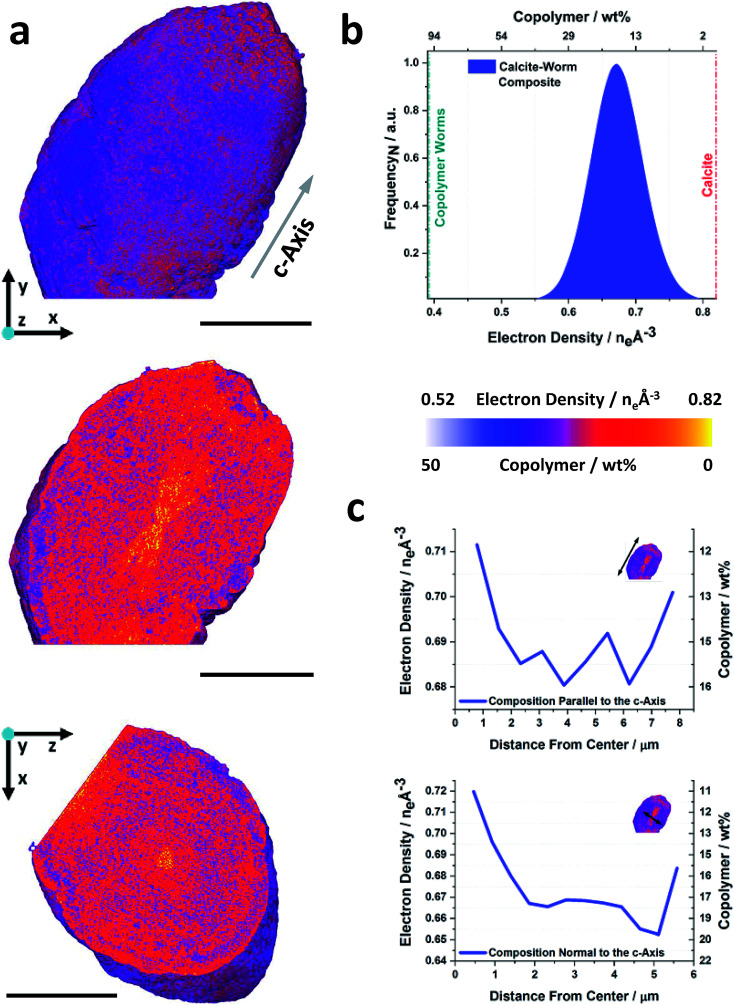
Fig. 4. Ptychographic X-ray computed tomography of a calcite nanocomposite crystal occluding diblock copolymer worms. (a) Volume rendering, and orthoslices through the electron density tomogram of a calcite crystal occluding copolymer worms (PMAA70–BzMA150). Common to both orthoslices is a single color scale ranging from white to yellow, where this is representative of the electron density value or weight percent of copolymer. (b) Electron density histogram, electron densities of the reference components are indicated. (c) Radial distribution profiles showing the compositional variation parallel and normal to the crystallographic c-axis as a function of distance from the composite center. The scale bars are 5 μm, the voxel size is (38.8 nm)3 and the measurements were conducted under cryogenic conditions.

Fig. 4