
Extended Data Fig. 4 |. 25HC has little effect on the early life-cycle stages of L. monocytogenes.
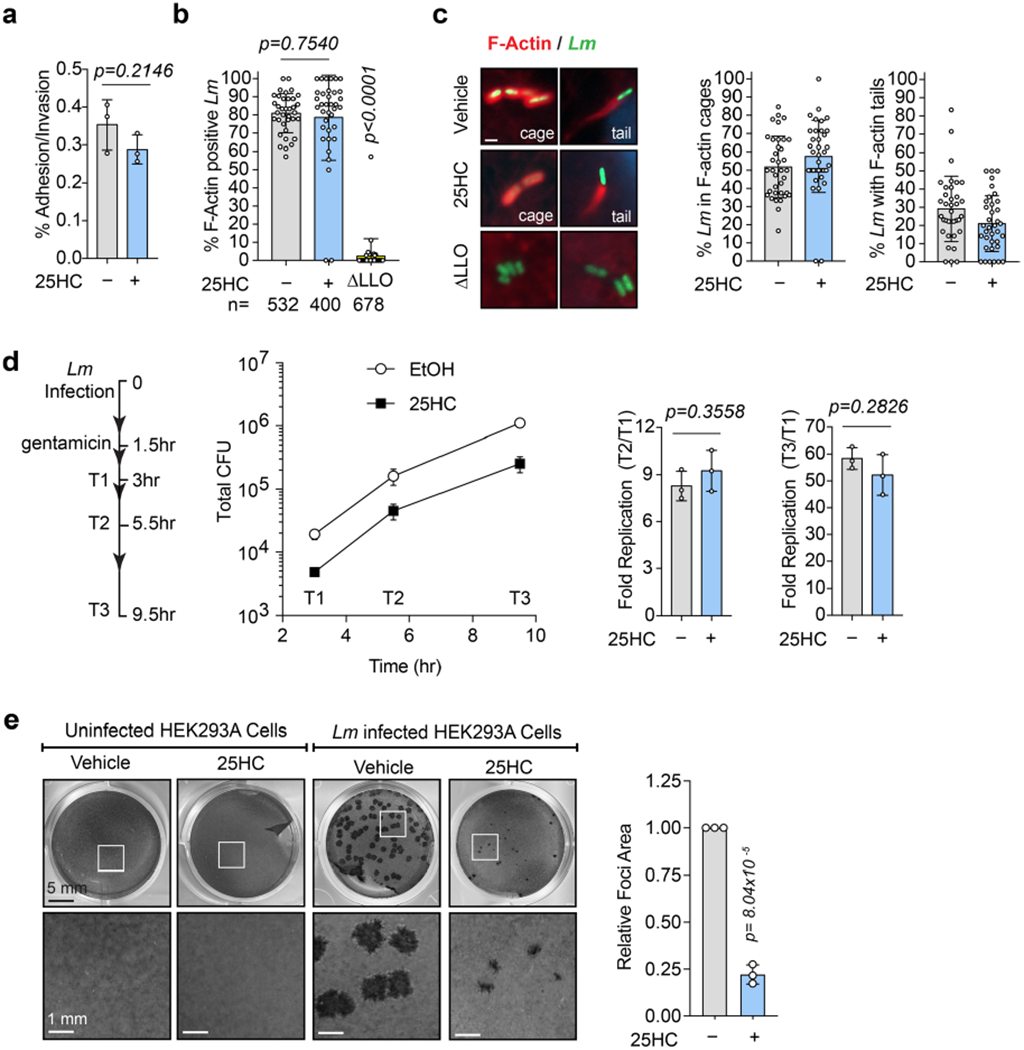
a, 25HC does not inhibit L. monocytogenes adhesion/invasion. The percent adhesion/invasion is shown. Bars represent mean values. Error bars show s.d. from three independent experiments and statistical significance was determined by student’s unpaired t-test (two-tailed). b, 25HC does not inhibit L. monocytogenes vacuole escape. The number of internalized bacteria that escape the phagocytic vacuole was determined by quantifying percent cytosolic L. monocytogenes that polymerize actin (F-actin cages or tails). L. monocytogenes lacking LLO was used as an escape-deficient control. Each data point represents the percent of bacteria that nucleate F-actin per field of view. The total number of individual bacteria assessed for F-actin nucleation is also indicated. Bars represent mean values. Error bars show s.d. and statistical significance was determined by student’s unpaired t-test (two-tailed). c, 25HC does not inhibit L. monocytogenes actin polymerization. Images (left) of GFP-expressing L. monocytogenes (green) and F-actin structures associated with cytosolic bacteria (phalloidin, red). Nuclei were labelled with DAPI (blue). Scale bar, 1 μm. Graph shows the frequency of F-actin structures nucleated by bacteria in host cells treated with vehicle or 25HC (5 μM). These data were collected from the experiments performed in (b). Bars represent mean values, and error bars are s.d. d, 25HC does not inhibit L. monocytogenes replication in host cells. Schematic indicating the time points of sample collection after bacterial infection. The total CFU recovered at each time point is shown (line graph). Bacterial replication was determined by calculating the ratio of CFU recovered at the indicated time points (T2 or T3) relative to the CFUs recovered after 3 hours of infection (T1). Mean values were plotted (left), and bars (right) represent mean values. Error bars show s.d. from three independent experiments and statistical significance was determined using student’s unpaired t-test (two-tailed). e, Left, representative images of L. monocytogenes cell-to-cell dissemination foci in HEK293A monolayers. Scale bar, 1 mm. Right, graph showing mean dissemination foci area formed by L. monocytogenes. Bars represent mean values. Error bars show s.d. of foci area normalized to vehicle-treated cells from three independent experiments. Statistical significance was determined prior to normalization by student’s unpaired t-test (two-tailed).