
Fig. 3 |. 25HC inhibits L. monocytogenes infection in local tissue environments.
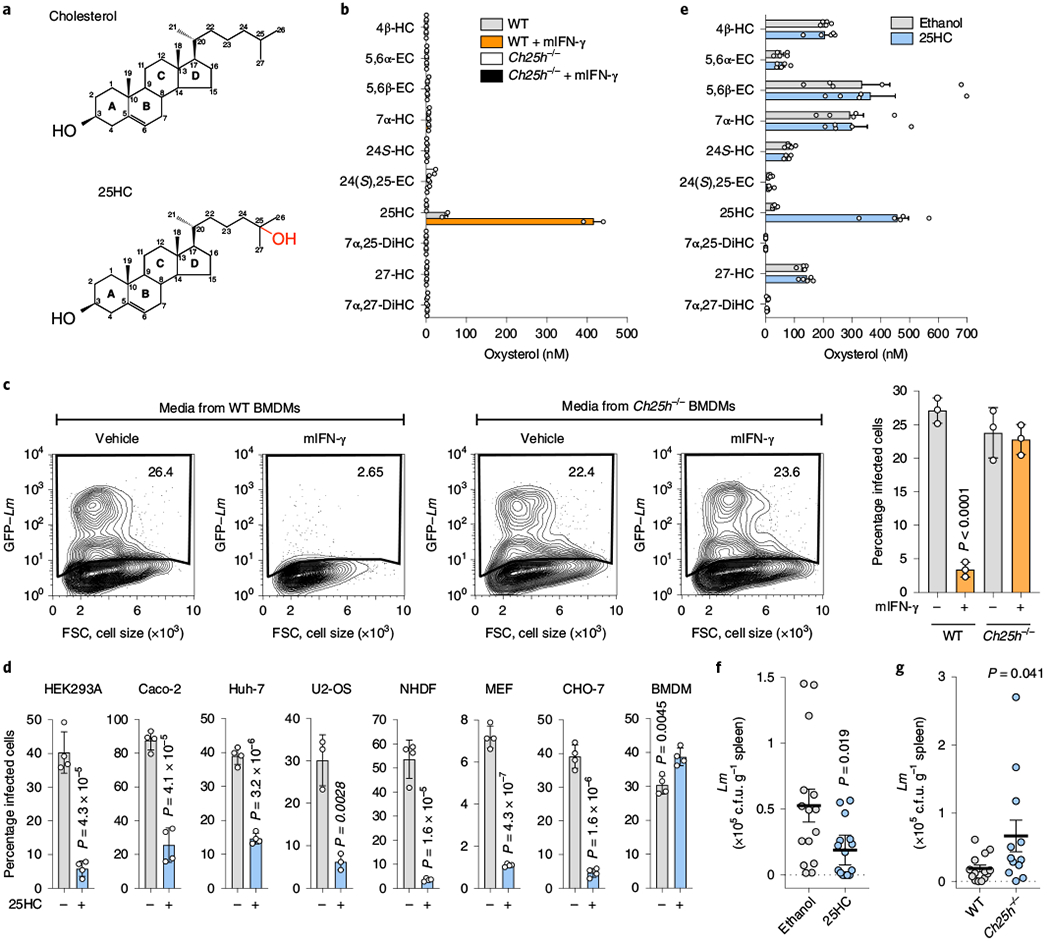
a, Chemical structures of cholesterol (top) and 25HC (bottom). b, Concentration of the indicated oxysterols in media collected from WT or Ch25h−/− BMDMs treated with either mIFN-γ or vehicle for 24 h. The bars represent the mean values. The error bars show the s.d. from two independent experiments. See Methods for the oxysterol nomenclature. c, HEK293A cells were cultured in media collected from WT or Ch25h−/− BMDMs treated with mIFN-γ or vehicle as described in Fig. 1a and infected as in Fig. 1b. Left, representative flow cytometry plots showing the percentage of infected cells. Flow cytometry plots are representative of three independent experiments. Right, percentage of infected cells determined from three independent flow cytometry experiments. The bars represent the mean values. The error bars show the s.d. and statistical significance was determined using a Student’s unpaired t-test (two-tailed). d, Quantification of L. monocytogenes infection of immortalized cell lines, primary normal human dermal fibroblasts (NHDFs) and BMDMs treated with 25HC. See Methods for the infection conditions. The bars represent the mean values. The error bars show the s.d. from four independent experiments for all except U2-OS (n = 3) and statistical significance was determined using a Student’s unpaired t-test (two-tailed). e, Concentration of the indicated oxysterols in the serum collected from ethanol- (vehicle, n = 5) or 25HC-treated (n = 5) mice as described in f. The bars represent the mean values. The error bars show the s.e.m. f, Mice injected with either ethanol (vehicle, n = 15) or 25HC (n = 15) in the peritoneal cavity and infected with L. monocytogenes by oral gavage as described in Methods. Bacterial tissue transmission was determined 72 h post-infection by enumerating the bacterial colony-forming units (c.f.u.) recovered from whole-spleen homogenates. g, Ch25h−/− (n = 12) and WT (n = 14) mice were orally infected with L. monocytogenes as described in Methods. Bacterial tissue transmission was determined as in f. f,g, The horizontal lines represents the mean. The error bars are the s.e.m. and statistical significance was determined using a Student’s unpaired t-test (two-tailed).