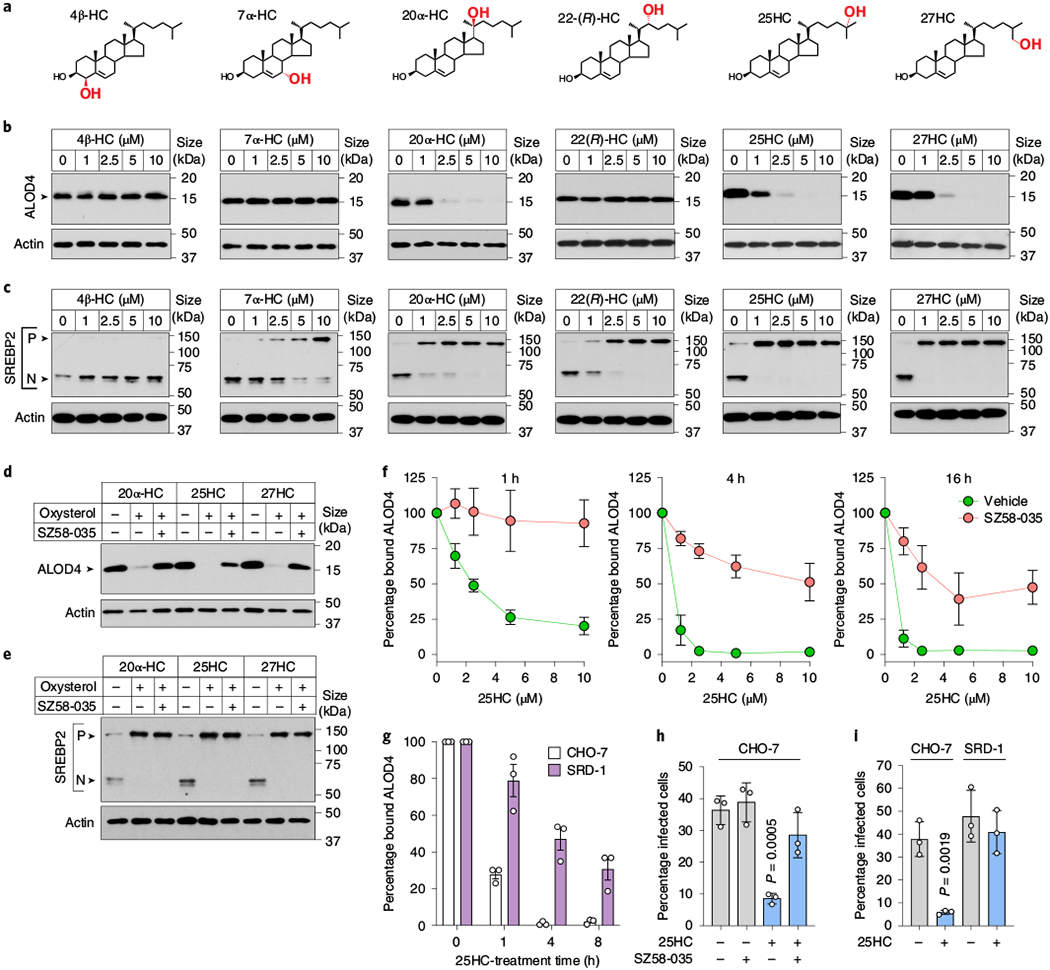
Fig. 6 |. Side-chain oxysterols mobilize accessible cholesterol through a concerted mechanism.

a, Oxysterol structures. b, Immunoblot showing ALOD4 bound to membranes of CHO-K1 cells treated with different concentrations of the indicated oxysterol. Immunoblots are representative of three independent experiments. c, Immunoblot showing SREBP2 processing in sterol-depleted CHO-K1 cells, which were incubated with increasing concentrations of the indicated oxysterols for 4 h. P, precursor form of SREBP2; N, nuclear form of SREBP2. Immunoblots are representative of three independent experiments. d,e, Immunoblots showing ALOD4 bound to the membrane (d) or SREBP2 processing (e) in CHO-K1 cells treated with 10 μM SZ58-035 or vehicle (dimethylsulfoxide) before the addition of the indicated oxysterols as described in b,c. See Methods for additional experimental details. Blots are representative of three independent experiments. f, Quantification of ALOD4 binding to membranes in CHO-7 cells pretreated with 10 μM SZ58-035 or vehicle (dimethylsulfoxide) and treated with the specified concentration of 25HC for the indicated times (1-h 25HC treatment, n = 4; 4-h treatment, n = 3; 16-h treatment, n = 3 except the 10 μM data point where n = 2) the following day. The mean values are plotted and the error bars show the s.e.m. g, Percentage of ALOD4 bound to the membranes of CHO-7 and SRD-1 cells treated with 25HC (5μM) for the indicated times. The bars represent the mean values. The error bars show the s.d. from three independent experiments. h, Percentage of L. monocytogenes-infected CHO-7 cells pretreated with SZ58-035 (10μM) and 25HC (5μM) as described in Methods. The bars represent the mean values. The error bars show the s.d. from three independent experiments and statistical significance in comparison to the vehicle was determined using a one-way ANOVA with Dunnett’s correction. i, Percentage of L. monocytogenes-infected CHO-7 and SRD-1 cells pretreated with 25HC (5μM) as described in Methods. The bars represent the mean values. The error bars show the s.d. from three independent experiments and statistical significance was determined using a Student’s unpaired t-test (two-tailed). h,i, The infection levels were assessed by flow cytometry.
