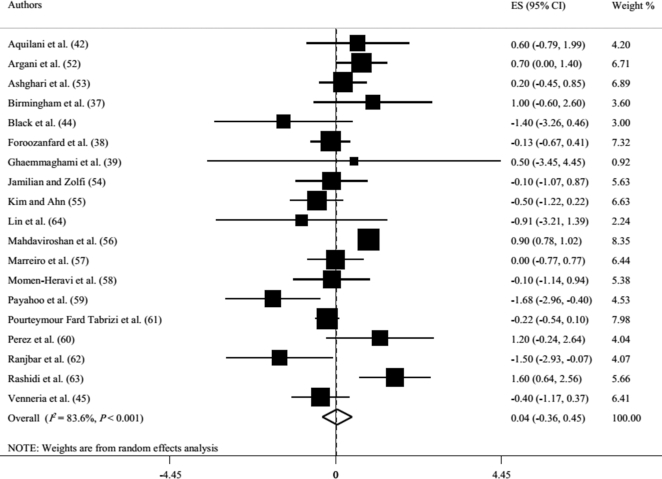
FIGURE 2.
Forest plot of randomized controlled trials showing weighted mean differences in weight change (in kilograms) between zinc supplementation and control groups for all eligible studies. Analysis was conducted using a random-effects model. Solid squares depict the weight assigned to the corresponding study; the black diamond represents the summary effect. ES, effect size.

