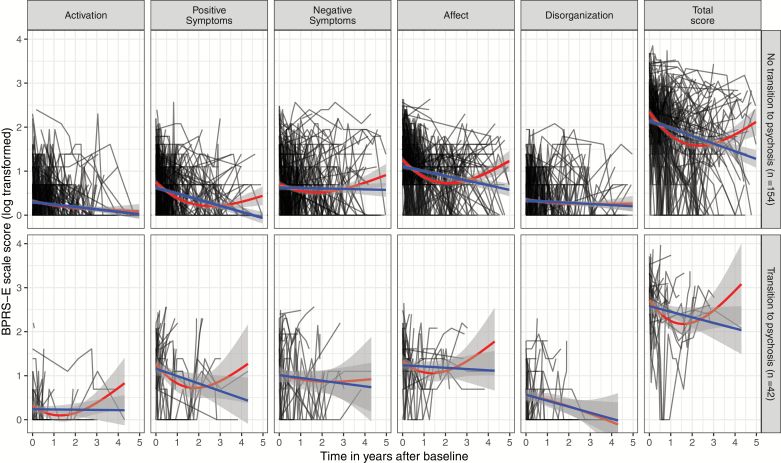
Fig. 1.
Trajectories of log transformed Brief Psychiatric Rating Scale-Expanded scores in patients with a clinical high risk for psychosis with (above) and without (below) transition to psychosis during the follow-up. The black lines are the individual trajectories, the blue lines are the averaged trajectories using a linear function, and the red lines are the averaged trajectories using natural cubic splines with 2 degrees of freedom.

