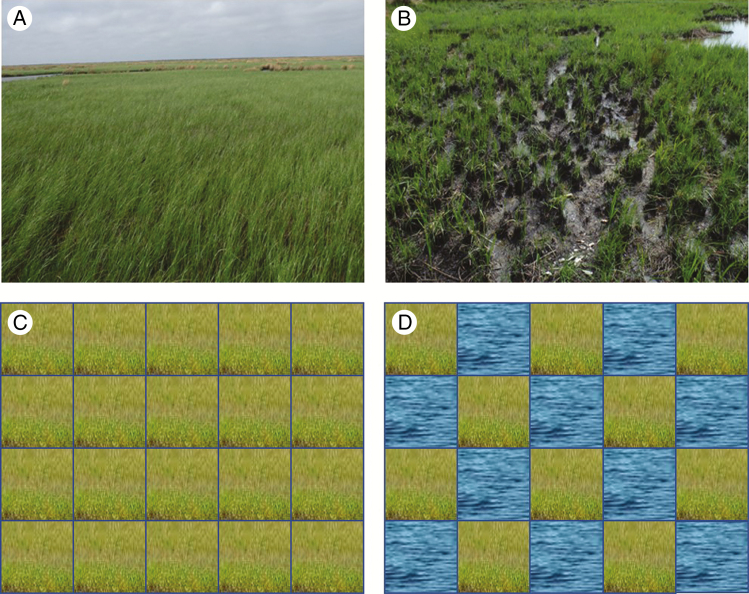
Fig. 2.
Process of wetland degradation represented by the relationship between wetland health (top panels) and landscape configuration (bottom panels). Healthy wetland (A) characterized by aggregated landscape (C), and degrading wetland (B) characterized by fragmented landscape (D). In the bottom panels, green represents land and blue represents water.

