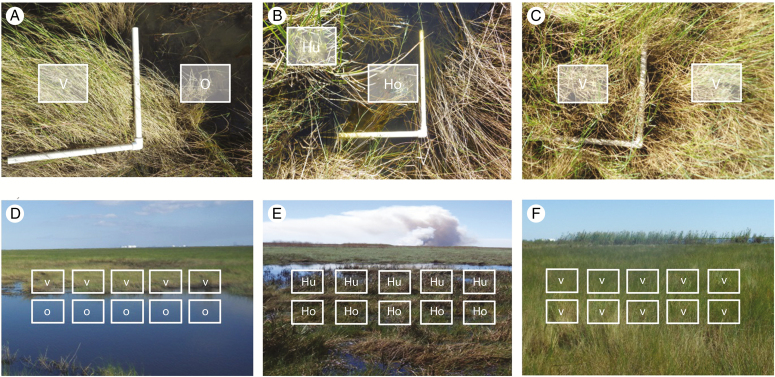
Fig. 5.
Top panels: transition zones in degrading sites (A) vegetation (V) to open water (O), (B) hummock (Hu) to hollow (Ho), and transition zones in healthy sites (C) vegetation remaining as vegetation. Bottom panels: transect schematic illustrating paired plot placement along transition zones in degrading sites (D) vegetation (V) to open water (O), (E) hummock (Hu) to hollow (Ho), and transition zones in healthy sites (F) vegetation remaining as vegetation.

