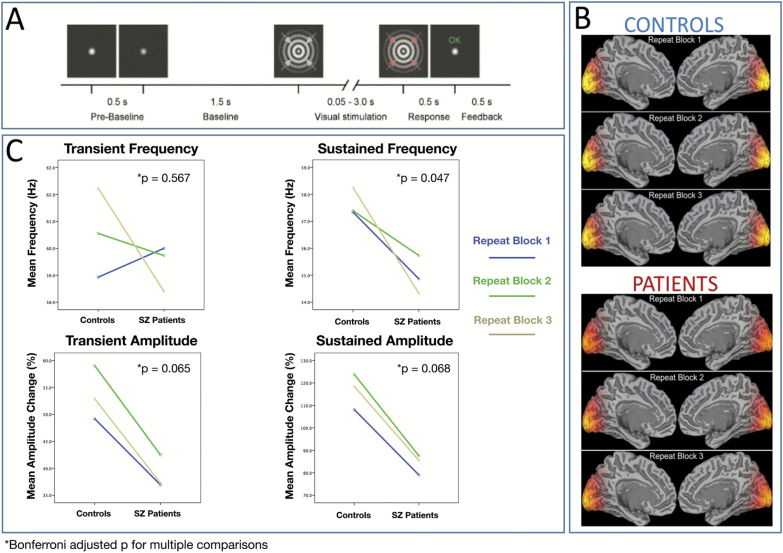
Fig. 2.
(A) Schematic of the stimuli and trial timings. (B) Group SAM beamformer reconstructions of the stimulus-induced gamma changes (30–80 Hz) during the sustained stimulus presentation time (50–3000 ms). For both participant cohorts, these group SAM maps are shown on an MNI template brain, for each of the three experimental runs. Bilateral gamma increases were seen in or close to the calcarine sulcus. (C) Quantification of SZ-related differences in gamma amplitude and frequency. These were assessed separately for the transient broadband gamma “spike” (0–300 ms) and the initial sustained gamma period (300–800 ms).

