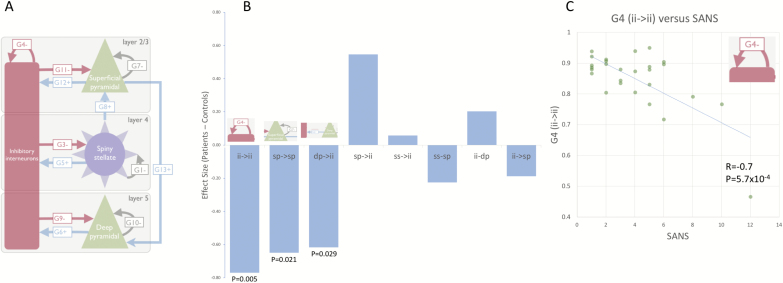
Fig. 4.
(A) DCM of the MEG data was performed using a CMC comprising 4 neural populations, with plausible neurophysiological connections and intrinsic time-constants. (B) Demonstrating the difference in synaptic connection strengths between SZ and controls. (C) The strength of inhibitory self-modulation of inhibitory interneuron populations predicts negative symptom score (SANS) in SZ (r = −.7, P = 5.7e-4, Bonferroni corrected P = .0046).

