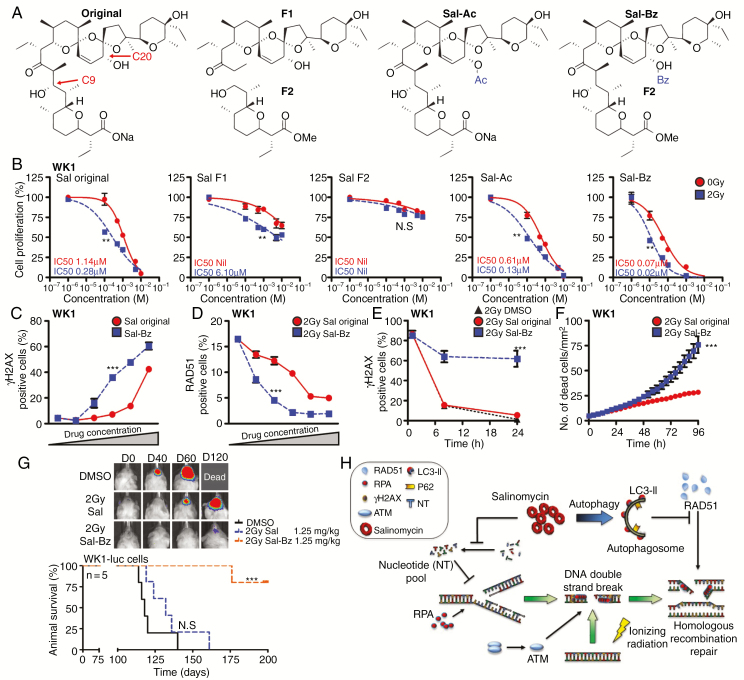
Fig. 6.
Benzene derivative analysis in vitro and in vivo. (A) Diagram showing the generated structural analogues of salinomycin. (B) A dose response curve of cell proliferation was used to compare derivatives versus Sal 96 hours posttreatment. (C, D) γH2AX or RAD51 positive cells (>5 foci per cell) were assessed by immunofluorescence to compare the response between Sal and Sal-Bz (1 µM–10 µM). (E, F) GNS cells were pretreated for one hour with 1 µM of DMSO, Sal, or Sal-Bz in combination with IR (2 Gy). γH2AX positive cells and cell death were quantified using IncuCyte analysis. (G) WK1-luc cells were intracranially engrafted in NOD/RAG mice; animals received a total dose of 10 mg/kg (brain weight) of DMSO, Sal, or Sal-BZ in 8 fractions of 1.25 mg/kg and survival determined by Kaplan–Meier plot. Statistical significance: **P < 0.01, ***P < 0.001. (H) Simplified model of the mechanism of action of salinomycin.

