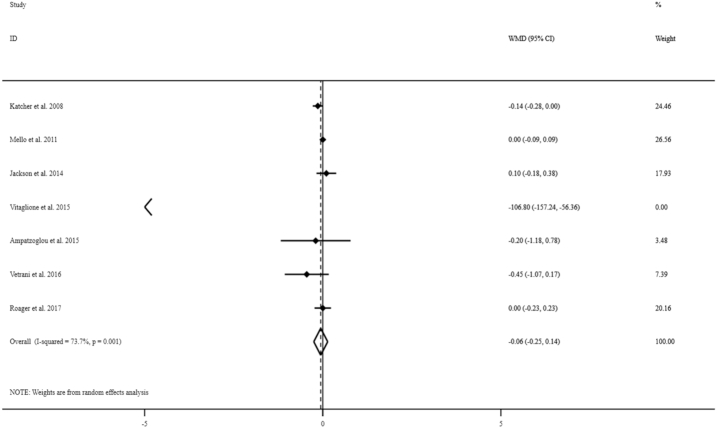
FIGURE 4.
Forest plots for the effect of whole-grain consumption on serum TNF-α concentrations in adults aged ≥18 y, expressed as mean differences between intervention and control groups. Horizontal lines represent 95% CIs. Diamonds represent pooled estimates from random-effects analysis. WMD, weighted mean difference.

