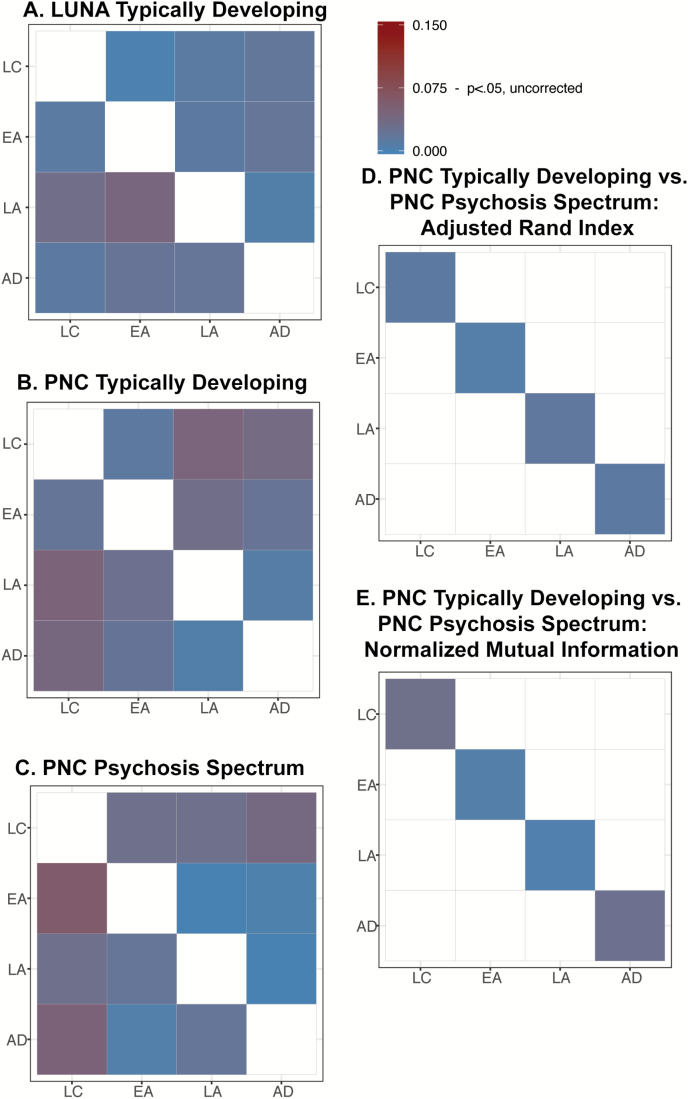
Fig. 3.
Dissimilarity statistics (δij) for the within cohort developmental comparison in (A) LUNA typically developing, (B) Philadelphia Neurodevelopmental Cohort (PNC) typically developing, and (C) PNC psychosis spectrum. Cool colors indicate that the cohorts are similar to each other, whereas warm colors reflect greater dissimilarity. For these comparisons, the upper right off-diagonals report test statistics for Adjusted Rand Index (ARI) and the lower left off-diagonals report test statistics for Normalized Mutual Information (NMI). Dissimilarity statistics (δij) for the comparison between PNC typically developing and PNC psychosis spectrum youth. (D) Bars reflect the test statistics for NMI. (E) Bars reflect the test statistic for ARI. All test statistics were much smaller than the approximate value needed to reach significance (0.075), uncorrected for multiple comparisons.

