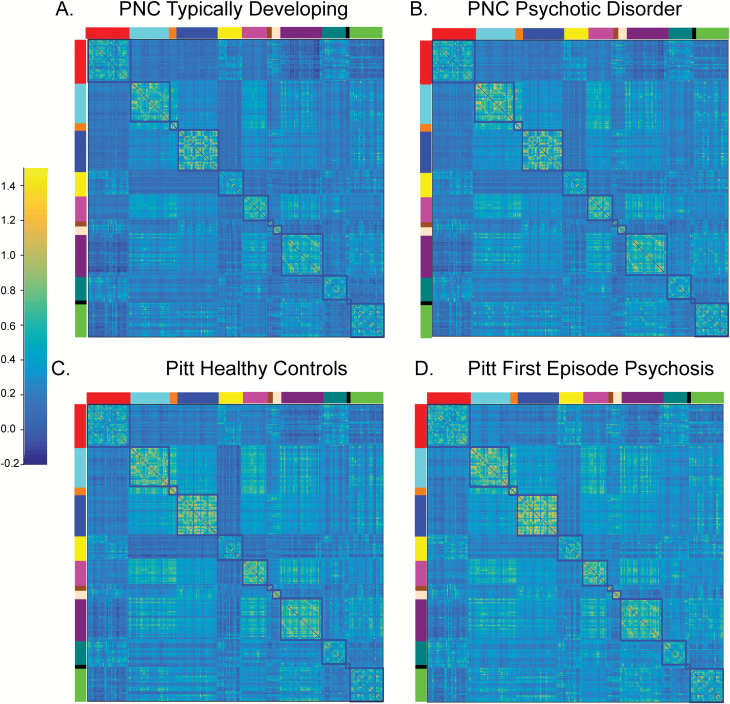
Fig. 4.
Correlation matrices at the group level for (A) Philadelphia Neurodevelopmental Cohort (PNC) typically developing, (B) PNC youth meeting full criteria for a psychotic disorder, (C) University of Pittsburgh (Pitt) healthy controls and (D) Pitt first episode psychosis. The correlation structure for all groups and cohorts is remarkably similar. The blocked colors around the edges of the correlation matrices refer to the resting-state fMRI networks identified from the reference parcellation.12 Networks are defined as follows: red (Default), light blue (somatomotor-hand); orange (somatomotor-hand), dark blue (visual); yellow (Frontoparietal); pink (Auditory); brown (Cingulo-parietal); peach (Retrosplenial Temporal); purple (Cingulo-opercular); dark green (Ventral Attention) black (Salience); bright green (Dorsal Attention). The color bar reflects the strength of the FIsher-Z transformed correlation.

