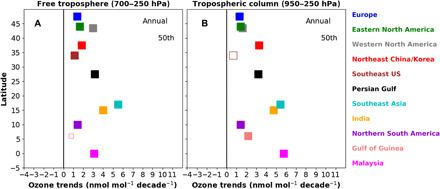
Fig. 2.

Annual trends of median ozone (nmol mol−1 decade−1) for two columns definition in the troposphere. Trends in the free troposphere (700 to 250 hPa) are shown in (A) and trends in the tropospheric column (950 to 250 hPa) are shown in (B). The trends are calculated between 1994 and 2016 above western North America (gray), eastern North America (green), Europe (blue), Northeast China/Korea (red), southeast United States (brown), South America (purple), Gulf of Guinea (salmon), India (orange), and Southeast Asia (cyan); between 1998 and 2016 above the Persian Gulf (black); and between 1995 and 2016 above Malaysia/Indonesia (magenta). For South America, the lower limit of the columns is at 600 hPa for data availability. Large squares indicate trends with P values less than 0.05; open large squares indicate trends with P values between 0.05 and 0.1, and open small squares indicate P values greater than 0.1.
