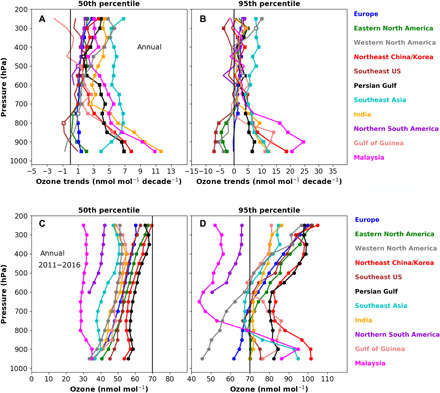
Fig. 3. Annual trends and distribution of the 50th and 95th percentiles of ozone (nmol mol−1 decade−1) at intervals of 50 hPa.

The trends (A and B) are calculated between 1994 and 2016 above western North America (gray), eastern North America (green), Europe (blue), Northeast China/Korea (red), southeast United States (brown), South America (purple), Gulf of Guinea (salmon), India (orange), and Southeast Asia (cyan); between 1998 and 2016 above the Persian Gulf (black); and between 1995 and 2016 above Malaysia/Indonesia (magenta). Squares indicate trends with P values less than 0.05. Open squares indicate trends with P values between 0.05 and 0.1. The zero trend value is indicated with a vertical black bar. The annual profiles of absolute values of ozone (C and D) are for the recent period 2011–2016 above the same 11 regions. For reference, the 70 nmol mol−1 value is indicated with a vertical black line, which corresponds to the U.S. National Ambient Air Quality Standards for ozone and is the annual fourth-highest daily maximum 8-hour average concentration averaged over 3 years.
