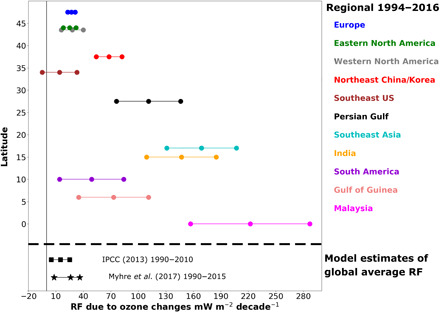
Fig. 6. RF due to ozone above the 11 regions and globally.

The circles and bars show the average RF and its range of uncertainty for the 11 regions. The squares and bars show the global average RF and its range of uncertainty from IPCC (2013) (2), and the stars and bars show the global average RF and its range of uncertainty from the work of Myhre et al. (8).
