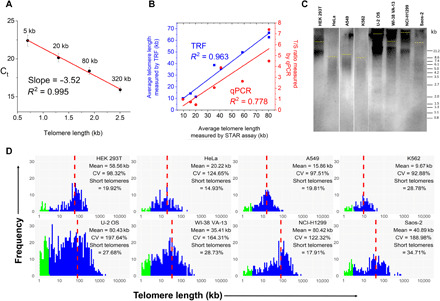
Fig. 2. STAR assay allows single molecule telomere length measurement.

(A) Standard curve generated by plotting Ct values versus telomere length (log scale) for four telomere standards (5 to 320 kb). Data are presented as means ± SD (n = 770 compartments). (B) Correlation of average telomere length of eight cancer cell lines measured by STAR assay with the average telomere lengths measured by TRF (blue) and qPCR (red). (C) TRF image for the eight human cancer cell lines. The yellow line indicates the average telomere length for each cell line. (D) Histograms showing the telomere length distributions for eight human cancer cell lines with the average telomere length (mean), coefficient of variation (CV), and percentage of short telomeres (<3 kb) indicated in each. The proportion of short telomeres is highlighted in green. The average telomere length is marked by the red dotted line.
