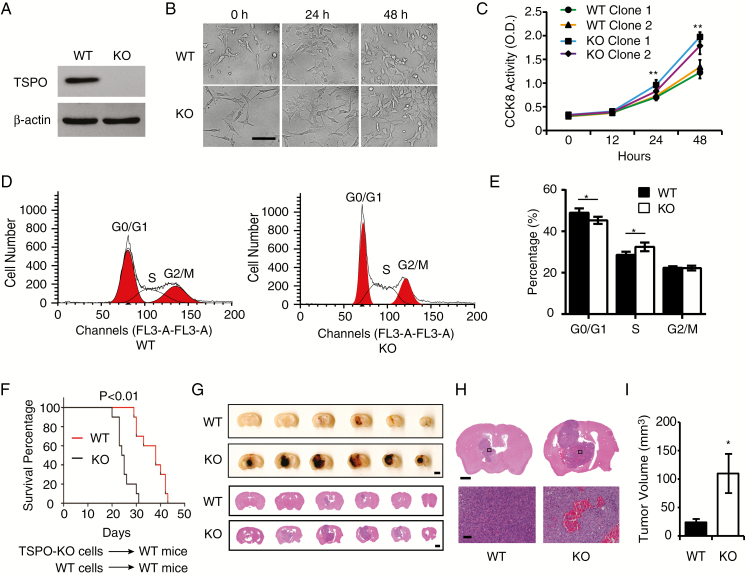
Fig. 1.
TSPO deletion promotes the proliferation of glioma cells and the growth of glioma in an intracranial xenograft glioma model. (A) Western blot verified the loss of TSPO expression in TSPO-KO GL261 cells in which the gene was knocked out using the CRISPR/Cas9 system. (B) Images of TSPO-KO and WT GL261 cells were acquired at 0, 24, and 48 hours of culture. Scale bar, 100 μm. (C) CCK-8 assay. (D) Flow cytometry for cell cycle analysis. (E) Quantitation of the percentages of cells in different phases of the cell cycle shown in (D). (F) Survival curves for the mouse intracranial xenograft glioma model following the injection of WT or KO GL261 cells into the brains of WT mice. (G) Representative images of a series of slices from one mouse brain with glioma without staining (upper panel) or with HE staining (lower panel) captured 20 days after the intracranial injection of KO or WT cells. Scale bar, 1 mm for upper images and 100 μm for lower images. (H and I) High-resolution images of HE-stained brain slices (H) and the quantification of tumor volumes (I). Scale bar, 100 μm. Three independent experiments were performed. The data are presented as means ± SEM. *P < 0.05 and **P < 0.01 as determined using Student’s t-test (C, E, and I) and the Gehan-Breslow-Wilcoxon test (F).

