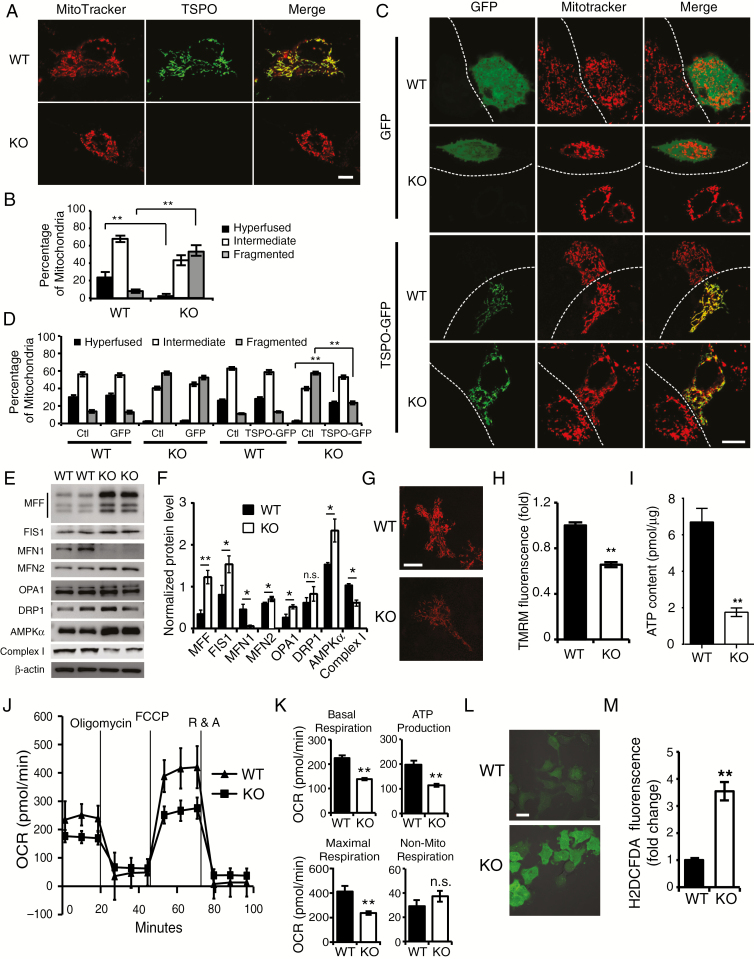
Fig. 3.
TSPO deficiency results in a larger number of fragmented mitochondria and a metabolic shift toward glycolysis. (A) Representative images of the mitochondria in KO and WT cells visualized with MitoTracker staining (red). TSPO was stained with an anti-TSPO antibody (green). Scale bar, 10 μm. (B) Quantification of different types of Mito-DsRed2-labeled mitochondria in (A). (C) Representative confocal microscopy images of the mitochondrial morphology in WT and KO cells transfected with TSPO-GFP or GFP expression vectors. Scale bar, 10 μm. (D) Quantification of different types of Mito-DsRed2-labeled mitochondria in (C). (E) Western blot analysis of the levels of mitochondrial fission/fusion proteins in TSPO-KO and WT GL261 cells. (F) Quantification of the western blot results shown in (E). (G and H) Representative images (G) and quantitative analysis (H) of TMRM staining in TSPO-KO and WT GL261 cells. Scale bar, 10 μm. (I) Measurement of ATP levels in TSPO-KO and WT GL261 cells. (J) Mitochondrial stress test to detect mitochondrial energy metabolism and respiratory functions in WT and KO GL261 cells. (K) Quantification of the mitochondrial stress test in (J). (L) Representative images (L) and quantification of ROS production (M) in both TSPO-KO and WT GL261 cells incubated with H2DCFDA. Scale bar, 10 μm. Three independent experiments were performed. The data are presented as means ± SEM. *P < 0.05, **P < 0.01, and n.s., not significant as determined using Student’s t-test (B, D, F, H, I, K, and M).

