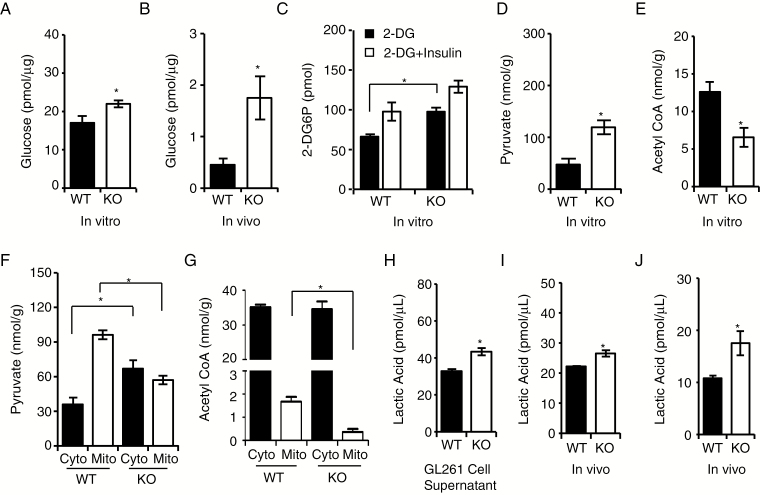
Fig. 5.
TSPO regulates glucose uptake and lactic acid conversion. (A and B) Glucose fluorometric assay to measure glucose levels in GL261 cells (in vitro) (A) and gliomas (in vivo) (B). (C) Glucose uptake assay to examine glucose uptake capacities in TSPO-KO and WT cells. Insulin stimulation was used as a positive control. (D) Colorimetric assay to measure pyruvate levels in TSPO-KO and WT GL261 cells. (E) Fluorometric assay to detect acetyl CoA levels in TSPO-KO and WT GL261 cells. (F) Colorimetric assay to measure pyruvate levels in the isolated mitochondria and cytosol from TSPO-KO and WT GL261 cells. (G) Fluorometric assay to measure acetyl CoA levels in isolated mitochondria and cytosol from TSPO-KO and WT GL261 cells. (H–J) Fluorometric assay to measure lactic acid levels in cell culture supernatants (H), GL261 cells (I), and gliomas (J). Three independent experiments were performed. The data are presented as means ± SEM. *P < 0.05 and **P < 0.01 as determined using Student’s t-test (A, B, C, D, E, F, G, H, I, and J).

