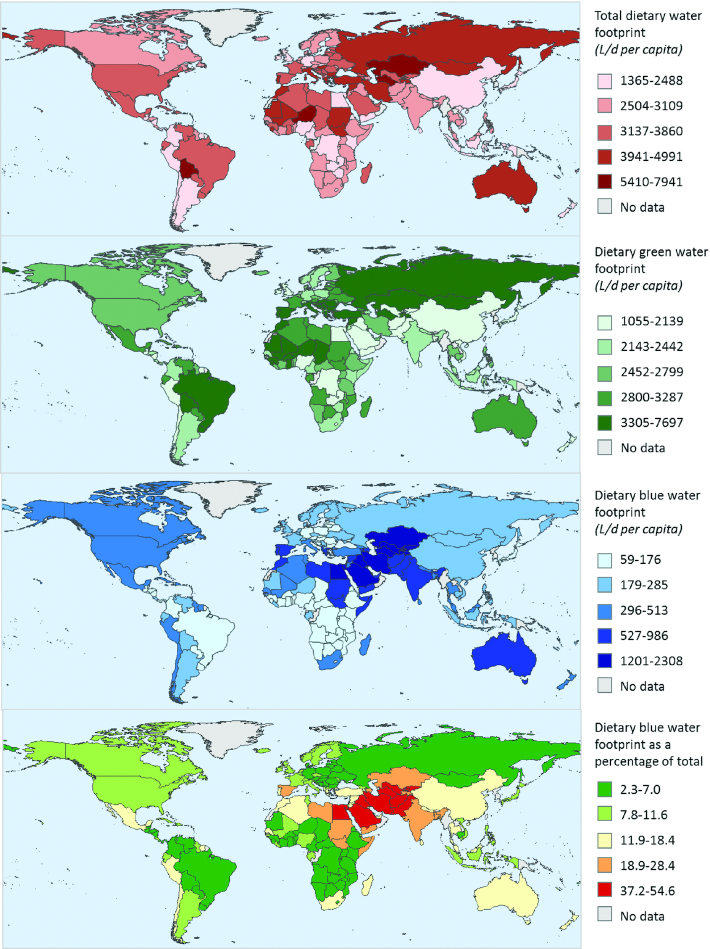
FIGURE 3.
National dietary total, green, and blue dietary WFs, and blue WFs as a percentage of the total WF. Values are the mean for the respective country including national and subnational estimates. Categories are defined by natural breaks (15). WF, water footprint.

