Fig. 3.
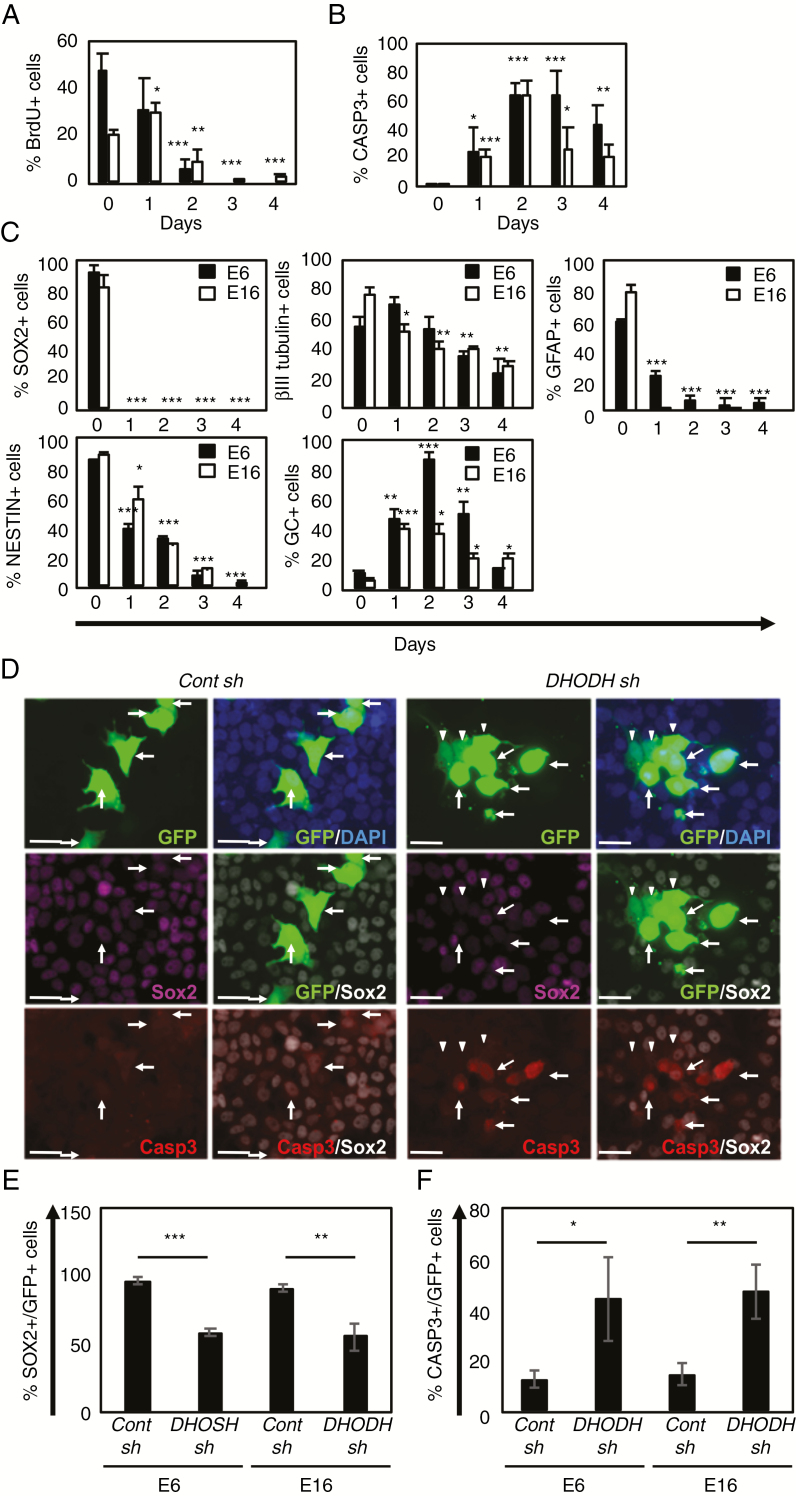
10580 induces cell cycle arrest, cell death, and differentiation in GICs.
(A) Proportion of BrdU+ cells among E6 (black column) and E16 GICs (white column) cultured in the presence of 10580. (B) Proportion of CASP3+ cells among E6 (black column) and E16 GICs (white column) cultured in the presence of 10580. (C) Proportion of cells stained for the NSC markers SOX2 and NESTIN and the differentiation markers βIII tubulin, GFAP, and GC, in E6 (black column) and E16 GICs (white column) cultured in the presence of 10580. (D) Representative photographs of either control (cont)-sh- or DHODH-sh-expressing E6 cells that were immunostained for GFP (green), SOX2 (purple or white), and CASP3 (red). In cont-sh cells (left panels), arrows indicate GFP+/SOX2+/Casp3− cells. In DHODH-sh cells (right panels), arrows indicate GFP+/Sox2+/−/Casp3+ cells, arrowheads indicate GFP+/SOX2−/CASP3− cells. Nuclei were counterstained with 4′,6′-diamidino-2-phenylindole (blue). Scale bar: 30 µm. (E) Proportion of SOX2+ cells among either cont-sh- or DHODH-sh-expressing GICs (GFP+). (F) Proportion of CASP3+ cells among either cont-sh- or DHODH-sh-expressing GICs (GFP+). All experiments were repeated at least 3 times with similar results. Error bar: ±SD. Statistical significance was determined by the t-test. *P < 0.05, **P < 0.01, ***P < 0.001.

