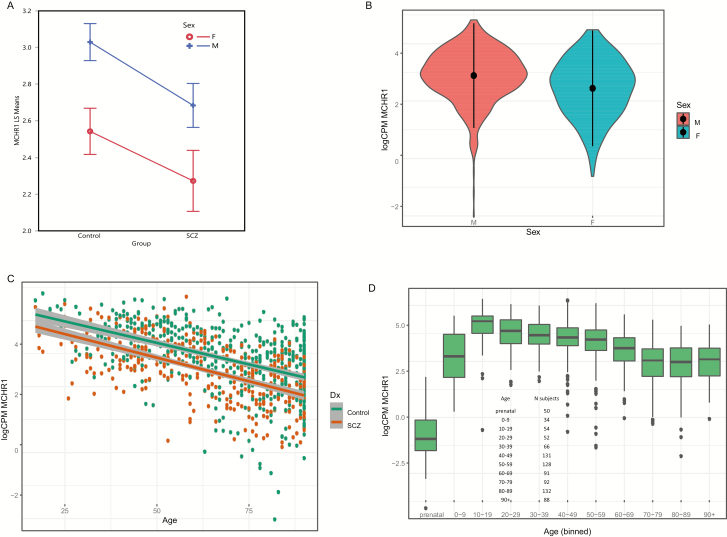
Figure 1.
(A) The main effect of MCHR1 expression (least square means, y-axis) and group (x-axis) showed a significant decrease in subjects with schizophrenia (FDR P value = 2E-04) and the decreased expression was parallel across sex. Females showed a decreased expression of MCHR1 (FDR P value = 1.6E-02). F = female; M = male. (B) Violin plot of MCHR1 expression by sex, with mean ±SD superimposed for control and schizophrenia samples shown in Table 1. Females showed a decreased expression of MCHR1 (FDR P value = 1.6E-02). (C) Scatter plot for age and sex using the 901 schizophrenia and control PFC samples (Table 1, demographics) showing a significant age-related decrease in expression of MCHR1. Multiple R-squared = 0.2452, adjusted R-squared = 0.2443, P value (2-sided) t test for linear regression coefficient of MCHR1 expression and age of death P = 6.6E-57. Note that data are binned for all subjects ages >90 years. (D) Box plot for MCHR1 expression across the lifespan. Capstone control prefrontal cortex data obtained from (https://www.synapse.org/#!Synapse:syn12080241). The number of subjects in each age bin is shown in the inset.

