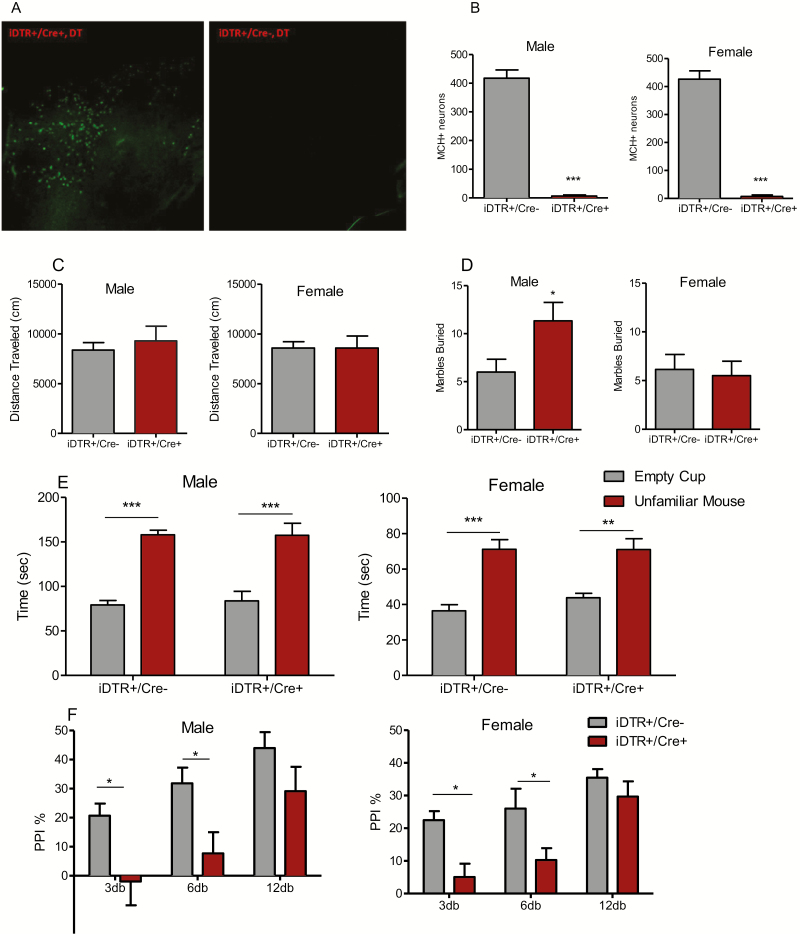
Figure 5.
Behavioral phenotype of conditional ablation MCH neurons. (A) MCH immunoreactivity in the lateral hypothalamus of iDTR+/Cre− and iDTR+/Cre+ mice following DT administration. (B) Counts of MCH immunoreactive neurons in DT-treated iDTR+/Cre- and iDTR+/Cre+ mice. Unpaired t test (male: t = 13.67, P < .0001, female: t = 10.72, P < .0001), ***P < .0001. Data are presented as mean ± SEM. (C) Distance mice travelled in 60 minutes of locomotion test, unpaired student t test: male: t = 0.589, P = .567 (n = 6); female: t = 0.001, P = .99 (n = 8). Data are presented as mean ± SEM. (D) Number of marbles buried in 30 minutes: male: t = 2.27, P = .046 (n = 6), female: t = 0.3, P = .76. Unpaired student t test iDTR+/Cre- vs iDTR+/Cre+, *P < .05 (n = 8). (E) Time mice spent interacting with empty cup and control mice in social interaction test: male: genotype effect, 2-way ANOVA, F1,36 = 0.039, P = .84. Bonferroni post hoc test: empty cup vs unfamiliar mouse, iDTR+/Cre−: t = 5.945, P < .001, iDTR+/Cre+: t = 5.553, P < .001 (n = 10); female: genotype effect, 2-way ANOVA, F1,36 = 0.5725, P = .45. Bonferroni post hoc test: empty cup vs unfamiliar mouse, iDTR+/Cre−: t = 5.702, P < .001, iDTR+/Cre+: t = 3.634, P < .001. **P < .01, ***P < .001 (n = 12 and 8 for iDTR+/Cre− and iDTR+/Cre+, respectively). Data are presented as mean ± SEM. (F) Prepulse inhibition ratio: male: 2-way ANOVA, genotype effect (F1,54 = 15.22, P = .0003), prepulse intensity effect (F2,54 = 9.049, P = .0004) followed by Bonferroni post hoc test: iDTR+/Cre− vs iDTR+/Cre+, *P < .05 (n = 7); female, 2-way ANOVA, genotype effect (F1,39 = 14.68, P = .0005), prepulse intensity effect (F2,39 = 11.23, P < .0001). Bonferroni post hoc test: iDTR+/Cre− vs iDTR+/Cre+, *P < .05 (n = 8 and 7 for iDTR+/Cre− and iDTR+/Cre+, respectively).

