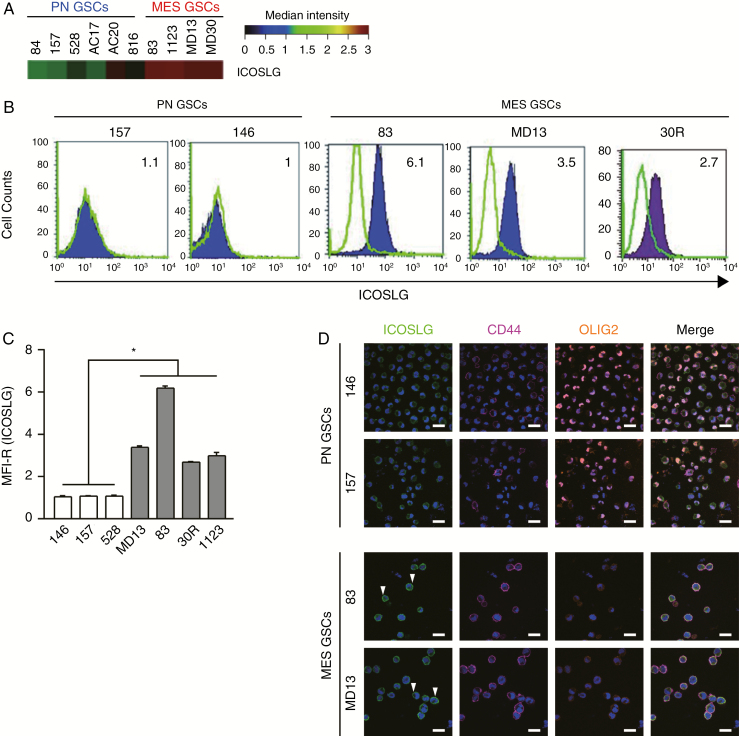
Fig. 1.
ICOSLG is highly expressed in MES GSCs. (A) ICOSLG mRNA expression was analyzed in MES and PN GSCs with transcriptomic microarray experiments. Total mRNA was extracted from GSCs and analyzed to create a gene expression profile. Results are expressed as the mRNA expression fluorescence intensity. (B) GSCs were stained with isotype control (green histograms) or ICOSLG-specific (purple histogram) antibodies and analyzed with flow cytometry. (C) The mean fluorescence intensity ratio (MFI-R) was calculated as the MFI of ICOSLG-positive sample histograms divided by the MFI of the control histogram. The MFI-Rs of the ICOSLG signal in the indicated GSCs are presented as the means ± standard error of 3 independent experiments (*P < 0.05, MES [n = 4] vs PN [n = 3], one-way ANOVA). (D) Immunofluorescent staining for ICOSLG expression in MES and PN glioma GSCs. The green fluorescence of ICOSLG on MES GSCs (arrowheads). The fluorescence of CD44 (purple) on the cell membrane. The fluorescence of OLIG2 (orange) in nuclei of PN GSCs. 4′,6′-Diamidino-2-phenylindole was used to stain nuclei (blue). Scale bars represent 20 μm.

