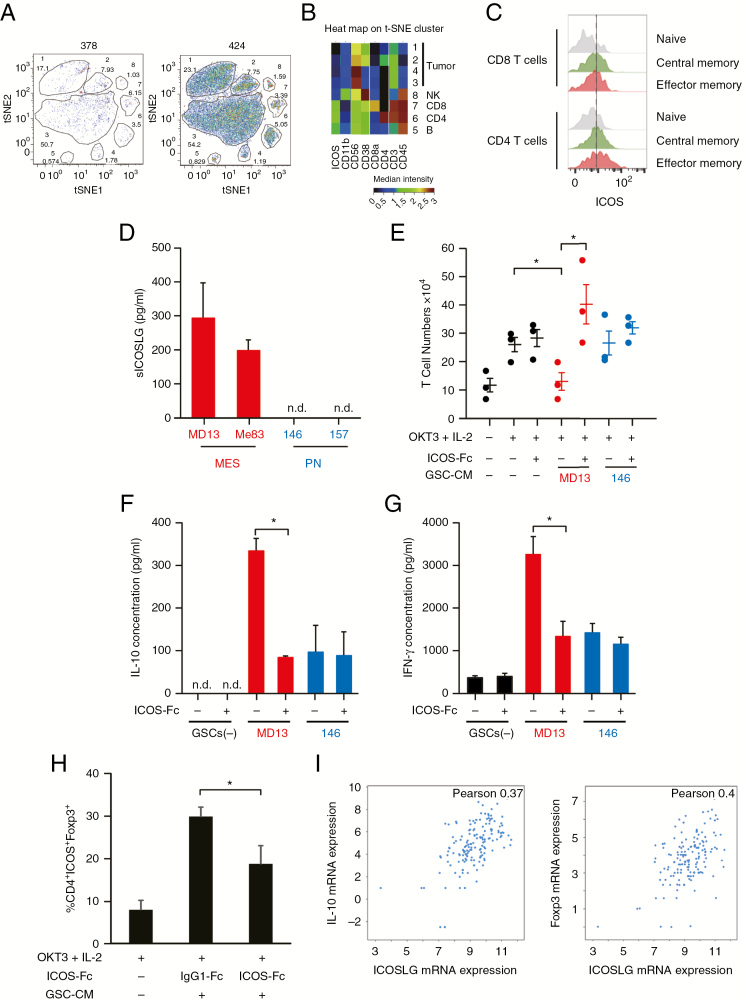
Fig. 3.
Effects of ICOSLG on immune cells. (A) Representative image of t-SNE analysis of 378 GBM cells. Upper number: Cluster ID (1 to 8). Bottom number: Cluster frequency in live cells (Cluster 1, 17.1%; Cluster 2, 7.93%; Cluster 3, 1.03%; Cluster 4, 1.78%; Cluster 5, 0.574%; Cluster 6, 3.5%; Cluster 7, 6.15%). (B) Heat map of the t-SNE cluster (424 GBM cells). (C) ICOS expression on CD4+ and CD8+ T cells in a GBM patient (patient 424). Gray; naïve, green; central memory, red; effector memory. (D) Production of soluble ICOSLG by MES and PN GSCs. Data represent the mean ± standard error of triplicate experiments. (E) Naïve peripheral CD4+ T cells were cultured with or without tumor cell conditioned medium. The cells were incubated with IL-2 (50 IU/mL) and OKT3 (0.2 µg/mL) in the presence of neutralizing antibodies (ICOS-Fc; 2 µg/mL) against ICOSLG or isotype-matched control antibodies (immunoglobulin G1–Fc; minus) for 6 days. After 6 days of culture, T cells were collected and analyzed. T cells were quantified using trypan blue exclusion, and T-cell expansion was calculated. Each symbol represents an independent experiment performed in triplicate, and horizontal bars represent the mean. *P < 0.05, Student’s t-test. (F) The ability of primed T cells to secrete IL-10 was assayed with ELISA. The cell number was adjusted before polyclonal restimulation with anti-CD3 (5 µg/mL) and anti-CD28 (1 µg/mL) monoclonal antibodies (mAbs) and supernatants were collected 24 h after. Data represent the mean ± standard error of independent experiments performed in triplicate (*P < 0.05, Student’s t-test). n.d. indicates that the measured value was below the detection limit of the assay (<20 pg/mL). (G) The ability of primed T cells to secrete IFN-γ was assayed with ELISA. The cell number was adjusted before polyclonal restimulation with anti-CD3 (5 µg/mL) and anti-CD28 (1 µg/mL) mAbs and supernatants were collected 24h after. Data represent the mean ± standard error of independent experiments performed in triplicate (*P < 0.05, Student’s t-test). n.d. indicates that the measured value was below the detection limit of the assay (<20 pg/mL). (H) CD4+ T cells cultured with MES GSC conditioned medium in the presence of ICOS-Fc or immunoglubulin G1–Fc were analyzed for the expression of ICOS and Foxp3 with flow cytometry. The percentages of ICOS+Foxp3+ cells in the CD4+ population are shown. Data represent the mean ± standard error of independent experiments performed in triplicate (*P < 0.05, Student’s t-test). (I) RNAseq data from n = 206 GBM patient samples (TCGA Research Network) were used to compare IL-10 and Foxp3 expression with expression of ICOSLG. Visualization of the data was performed using cBioportal.

