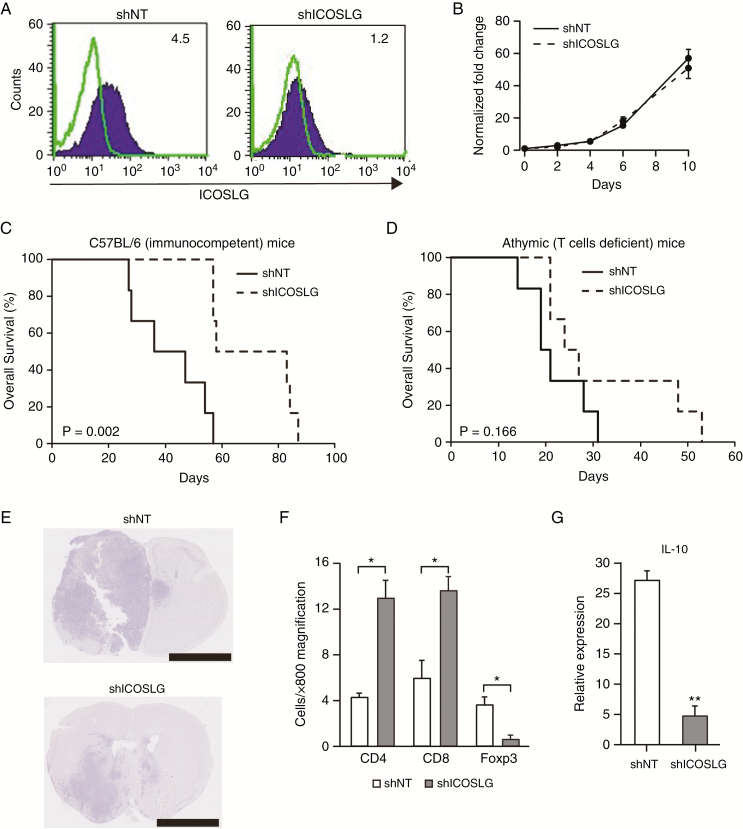
Fig. 4.
Effects of ICOSLG knockdown in vivo in a syngeneic brain tumor model. (A) Representative flow cytometry results showing ICOSLG expression in mouse RasR2 GSCs with stable induction of shICOSLG or shNT expression. The numbers in each panel indicate the MFI-R. (B) Effects of ICOSLG knockdown with shICOSLG on cell proliferation in RasR2 glioma spheres using Cell Counting Kit 8. (C) Kaplan–Meier survival analysis evaluating the correlation between shICOSLG and shNT in immunocompetent mice (C57BL/6) (n = 6 per group, P = 0.002, log-rank test). (D) Kaplan–Meier survival analysis evaluating the correlation between shICOSLG and shNT in athymic mice (Balb/c nu/nu) (n = 6 per group, shICOSLG vs shNT in athymic mice; Balb/c nu/nu mice, P = 0.166, log-rank test). (E) Representative images of hematoxylin and eosin staining of mouse brains harvested on day 30 after transplantation of RasR2 glioma spheres expressing shNT or shICOSLG. Scale bars, 2.5 mm. (F) Numbers of Foxp3+, CD4+, and CD8+ T cells were counted in RasR2 tumor sections from the identical C57BL/6 mouse model (6 fields at 800× magnification, means ± standard error, *P < 0.05). (G) RNA was extracted from RasR2 tumors in brains of C57BL/6 mice and used for real-time PCR. The level of IL-10 expression was normalized to the level of Hprt (mean ± standard error, **P < 0.01, n = 3–5).

