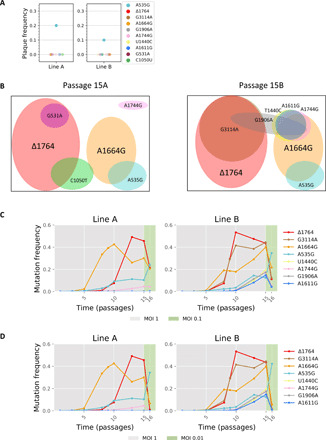
Fig. 2. Two major lineages of defective mutants.

(A) Frequency of mutants in 20 plaques seeded from p15. Of the mutations that arose in the original experiment, the only one observed in the plaques was A535G. (B) Results of haplotype inference based on MinION sequencing for virus populations from p15 line A (left) and line B (right). Each mutation is represented by a circle (color-coded as in Fig. 1A) whose size is roughly proportional to its frequency at p15. Our results suggest that two major cheater lineages are present in both populations with additional different hitchhiking mutations in each line. The full list of inferred haplotypes is given in table S1. (C and D) Details as in Fig. 1A and p1 to p14 are the same as in Fig. 1A. Passaging was reinitiated from a frozen stock of p14. p15 was created at an MOI of 1, yet p16 was created at lower MOIs: MOI of 0.1 (C) and MOI of 0.01 (D), marked in green. All panels show a strong decrease in defective frequencies at lower MOIs.
