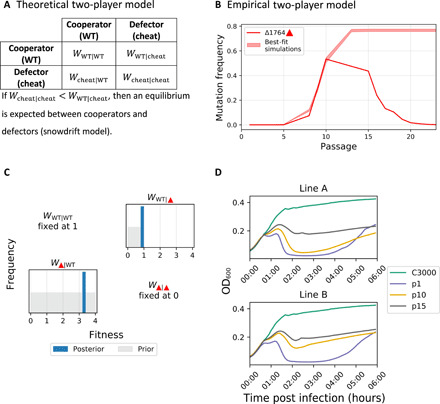
Fig. 4. Game theory–based modeling of a single cheater and WT dynamics.

(A) Theoretical fitness matrix of a cooperator-defector system, with notations, as described previously (47). (B) WT and single Δ1764 cheater model, empirical frequency measurements of line B (solid line) with an interval (band) derived from the posterior distribution. (C) Posterior distributions for inferred parameters (dark blue) versus prior distributions (gray). (D) Host cell lysis c3000 bacteria post infection with MS2 populations from p1, p10, and p15 from lines A and B. Notably, passaged populations with high proportions of Δ1764 (p15A, p10B, and p15B) display reduced cell lysis. On the other hand, p10A, which has a high proportion of A1664G, does not display reduced cell lysis.
