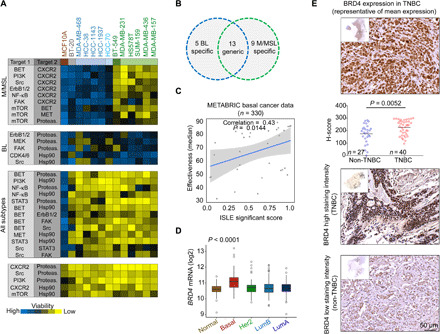
Fig. 1. Synthetic lethal combination therapies for TNBC subtypes.

(A) Heatmap representation of drug screen results. Inhibitors of the indicated target pairs (fig. S1A) were applied at very low doses (~2 to 20% of IC50 as a single agent, for most cases), and viability of the indicated cell lines (12 TNBC + MCF10A) was measured 72 hours later. Effects on cell viability were calculated as percentage of control untreated cells and marked by color codes; blue, no/low cell death; yellow, high cell death. Drug pairs that reduced cell viability (≥75%) across several cell lines were clustered together according to cell line subtypes. We defined pairs that were potent for mesenchymal cell lines (M/MSL, green), basal-like (BL1/2, blue), and those that were potent in all subtypes but had low effect on MCF10A (≤20%) viability. Toxic combinations affect all cell lines (bottom). Results are mean values of three experiments. Actual screen data are included in table S3. (B) Venn diagram of hits obtained in the screen; mesenchymal (M/MSL)–specific, BL-specific (BL), and generic, which were effective in all subtypes. (C) Scatterplot between ISLE significance scores and drug combination effectiveness. Spearman correlation and P value are shown. Basal breast cancer data (330 patients; METABRIC) were used in the ISLE pipeline. (D) Box plots of BRD4 expression in patients with breast cancer grouped by PAM50. The difference between the basal patients and any other PAM50 group is significant (t test, P value of <0.0001). (E) IHC analysis of BRD4 expression in TNBC and non-TNBC tumors. Staining intensity of BRD4 was scored as described in Materials and Methods. Representative images of BRD4 staining in TNBC (n = 40) and non-TNBC (n = 27) tissues along with a column scatterplot of the H-score distribution among the specimens are shown. The difference between the groups is significant (t test).
