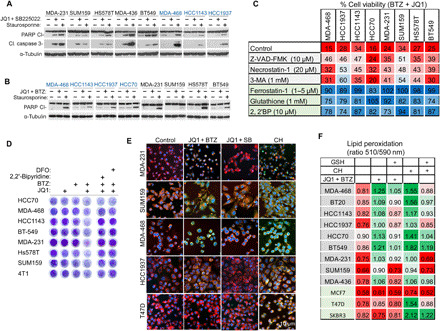
Fig. 4. Inhibition of BET and the proteasome triggers ferroptosis cell death.

(A and B) Effects of BET and CXCR2 inhibition (A) or BET and proteasome inhibition (B) on PARP (A and B) and caspase-3 cleavage (A) in the indicated cell lines (blue, BL1; black, M/MSL). Staurosporine (150 nM, 16 hours) was used as a positive control. The cells were treated with low doses of JQ1 and either SB225022 (A) or BTZ (B) for 24 hours as described in Materials and Methods, lysed, and assessed by Western blot (WB) for the indicated proteins. (C) Ferroptosis inhibitors rescue cell death induced by JQ1 and BTZ combination. The indicated cell lines were pretreated with the indicated cell death inhibitors for 1 hour and then for an additional 72 hours in the absence or presence of JQ1 and BTZ (see Materials and Methods). Cell viability (CellTiter-Blue) is presented as percentage of untreated cells. The effects of the inhibitors on their cognate death pathways are shown in fig. S6C. Mean values of three experiments are shown (means ± SD; table S6). (D) Iron chelators rescued cell death induced by JQ1 and BTZ treatment. The indicated TNBC cell lines were treated with JQ1 and BTZ (see Materials and Methods) for 72 hours in the absence or presence of deferoxamine (DFO) (100 μM) or 2,2′-dipyridyl (10 μM), and cell viability was assessed by crystal violet staining. (E) Representative confocal images of the indicated TNBC cell lines and T47D cells stained with C11-BODIPY (10 μM) as described in Materials and Methods. The cells were treated with cumene hydroperoxide (CH) (100 μM, 3 hours) as a positive control, and either with JQ1 + SB225022 or with JQ1 and BTZ (see Materials and Methods) for 16 hours. Scale bar, 10 μm. (F) Assessment of lipid peroxidation in breast cancer cells in response to BET and proteasome inhibition. TNBC (gray) and non-TNBC (green) cell lines were incubated with JQ1 and BTZ (see Materials and Methods) for 16 hours or with CH (100 μM, 3 hours). Where indicated, glutathione (1 mM; see Materials and Methods) was applied. Lipid peroxidation is shown as the ratio between fluorescence emission at 510 nm (green) and 590 nm (red) (see Materials and Methods). Mean values of three experiments are shown (mean values ± SD; table S7).
