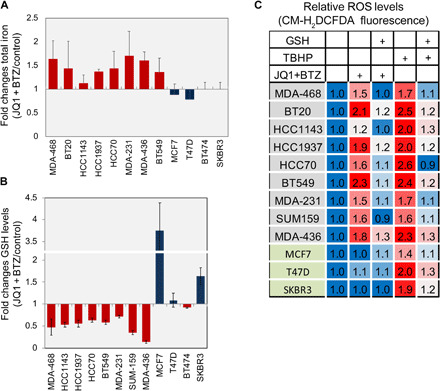
Fig. 5. Effects of BET and proteasome co-inhibition on cellular iron, GSH, and ROS levels.

(A and B) Inhibition of BET and the proteasome increased iron levels (A) and decreased GSH levels (B) in TNBC cell lines. TNBC and non-TNBC (MCF7, SKBR3, T47D, and BT474) cells were incubated with JQ1 and BTZ (see Materials and Methods) for 16 hours, and total iron (A) and reduced GSH (B) levels were measured as described in Materials and Methods. Mean values of three experiments are shown (mean values ± SD; table S8). (C) Inhibition of BET and the proteasome increased ROS in TNBC cells. The indicated breast cancer cells were treated with JQ1 and BTZ (see Materials and Methods) for 12 hours or with tert-butyl hydrogen peroxide (TBHP; 100 μM) for 2 hours. Where indicated, GSH (1 mM) was applied 1 hour before drug treatment. Cells were then incubated with CM-H2DCFDA to measure ROS as described in Materials and Methods. Results are expressed as folds of control in at least three experiments (mean values ± SD; table S9).
