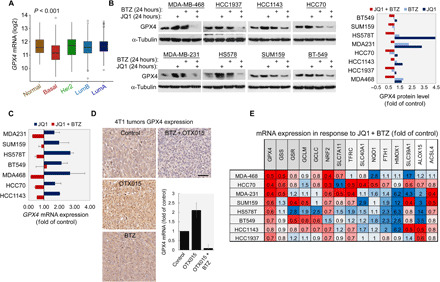
Fig. 6. BET and proteasome inhibition strongly affects GPX4 level and transcription of key ferroptotic genes.

(A) Box plot showing the expression of GPX4 in patients with breast cancer grouped by PAM50. The differences between the BL patients and any other PAM50 groups are significant (t test, P < 0.001). (B and C) Effects of BET and proteasome inhibition on the levels of GPX4 protein (B) and transcript (C). The indicated TNBC cell lines were treated with JQ1, BTZ, or both (see Materials and Methods) for 24 hours. Levels of GPX4 protein were assessed by WB. Intensities of GPX4 bands were quantified, normalized, and presented as fold of control in the bar graph (B). GPX4 mRNA levels were assessed by qPCR. Mean values ± SD of at least two repeats are shown (C). (D) Effects of BET and proteasome inhibition on level of GPX4 protein and transcript in 4T1 tumors. Representative IHC staining of 4T1 tumors treated with OTX015 (25 mg/kg per day, orally), BTZ (0.25 mg/kg, IP, every fourth day), or both to detect protein expression is shown. GPX4 mRNA levels were evaluated by qPCR. Results are mean values ± SD of at least six mice per group. (E) Effects of BET and proteasome inhibition on level of GPX4 transcript and additional key ferroptosis genes. The indicated TNBC cell lines were treated with JQ1 and BTZ (see Materials and Methods) for 24 hours, and mRNA levels of the indicated genes were assessed by qPCR. The results are reported as fold of control. Mean values of at least three independent experiments are shown (mean values ± SD; table S11).
