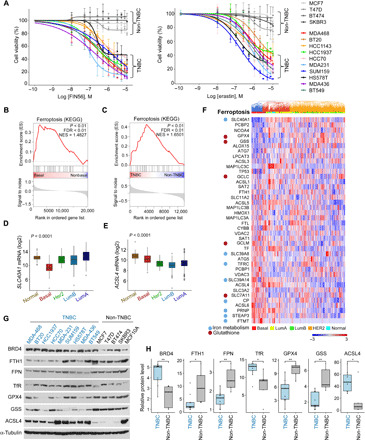
Fig. 7. TNBCs are vulnerable to ferroptosis and enriched in ferroptosis signature.

(A) Cell viability of the indicated TNBC and non-TNBC cell lines in response to increasing concentrations of Fin56 or erastin. The indicated cells were treated with FIN56 or erastin for 72 hours, and cell viability was measured by MTT assays. Mean values ± SD of three independent experiments are shown. The differences in the area under the curve between the TNBC and non-TNBC are significant (fig. S8A). (B and C) GSEA plot of normalized enrichment score of ferroptosis pathway for either basal versus non-basal patients in the TCGA dataset (B) or TNBC versus non-TNBC cell lines in the CCLE dataset (C). Enrichment is significant, P value/FDR < 0.01. (D and E) Box plots showing the expression of SLC40A1 (D) and ACSL4 (E) in patients with breast cancer grouped by PAM50. The differences between the basal patients and any other PAM50 group are significant (t test, P < 0.001). (F) Heatmap of normalized expression of the ferroptosis gene signature (KEGG, 40 genes) in patients with breast cancer from the TCGA dataset (n = 956). Patients (in columns) are arranged by unsupervised clustering of gene expression. Bar at the top of the heatmap indicates the subtype of each patient (PAM50). Ferroptotic genes that also belong to the iron metabolism or GSH signature are marked. (G and H) Levels of ferroptosis proteins and BRD4 in TNBC and non-TNBC cell lines. The expression levels of the indicated proteins were assessed by WB, and band intensities were quantified by ImageJ software. The relative expression in TNBC compared to non-TNBC is shown in the box plots (H) *P < 0.05, **P < 0.01.
