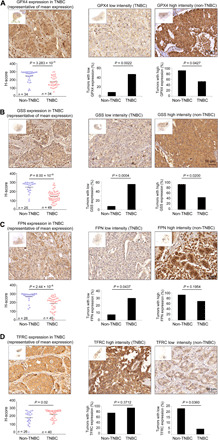
Fig. 8. IHC analysis of ferroptotic proteins in breast cancer samples.

(A to D) Representative images of IHC analysis of breast cancer specimens from patients with TNBC and non-TNBC patients immunostained with antibodies against GPX4 (A), GSS (B), Ferroportin (FPN) (C), and TfR (TFRC) (D). Approximately 65 breast cancer tissues were immunostained for each protein, and staining intensity was scored as described in Materials and Methods. The H-score of patients with TNBC relative to non-TNBC patients is shown in the scatter graphs. Percentages of tumors with low- or high-intensity scores are shown in the middle or right graphs along with representative images. Overall view of the entire section is shown as an insert for each image. Scale bars, 50 μm. Unpaired two-tailed t test was used to compare differences between H-scores of patients with TNBC and non-TNBC patients. Fisher’s exact test was applied to compare percentage of tumor sections with high or low protein expression between TNBC and non-TNBC groups.
