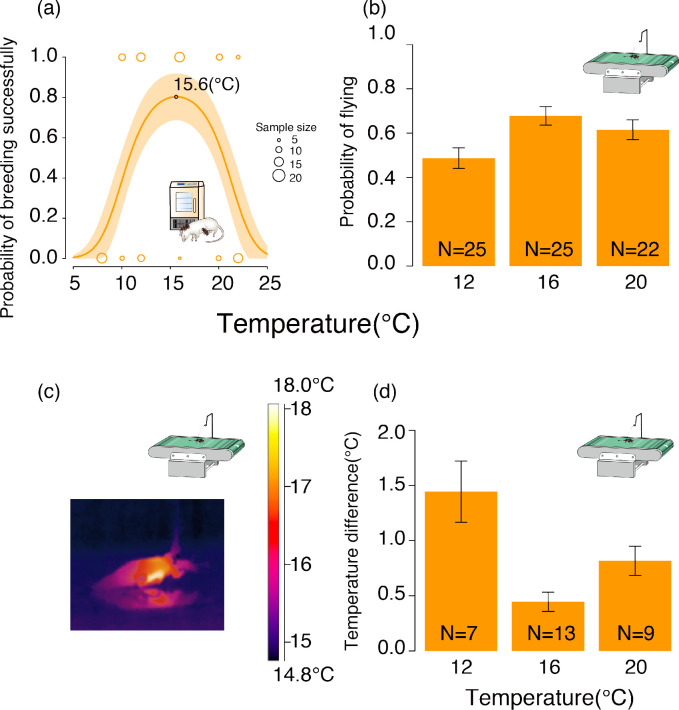
Figure 3. The fundamental thermal performance curve (TPC) of N. nepalensis represented by the relationship between the probability of breeding successfully and temperature in the lab.
(a) The probability of breeding successfully at different temperatures in the lab in the absence of competitors. The shaded orange area depicts the 95% confidence interval. The optimal temperature of the TPC, which is calculated by taking the derivative of the regression line, is indicated (χ²2 = 26.29, p < 0.001, n = 117). (b) The probability of flying in the three different ambient temperature conditions (χ²2 = 13.22, p = 0.001, n = 72) (c) Infrared thermal image of N. nepalensis running on the treadmill, and (d) the temperature difference between the body temperature of beetles that started flying and the ambient temperature in the three temperature conditions while beetles were running on the treadmill at a stable speed of 150 cm/min (χ²2 = 23.18, p < 0.001, n = 29).

