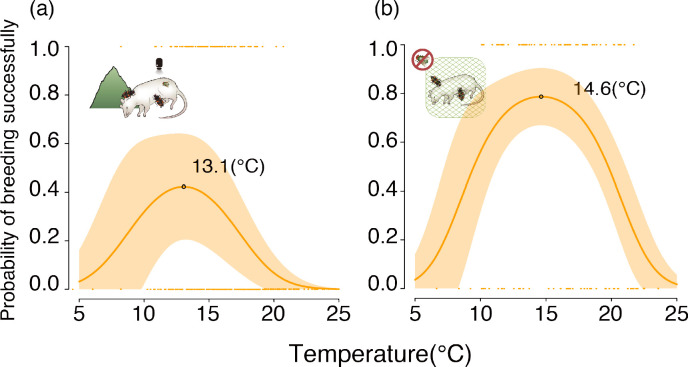
Figure 4. Realized thermal performance curves of N. nepalensis represented by the relationship between the probability of breeding successfully and temperature in the field.
The probability of breeding successfully along the temperature gradient (a) with the potential for interspecific competition (χ²2 = 16.56, p < 0.001, n = 343) and (b) in the absence of interspecific competition. The shaded orange area depicts the 95% confidence interval (χ²2 = 16.08, p < 0.001, n = 175). The optimal temperatures of the TPCs, which were calculated by taking the derivatives of the regression lines, are indicated. Pictures correspond to experiments detailed in Figure 1.

