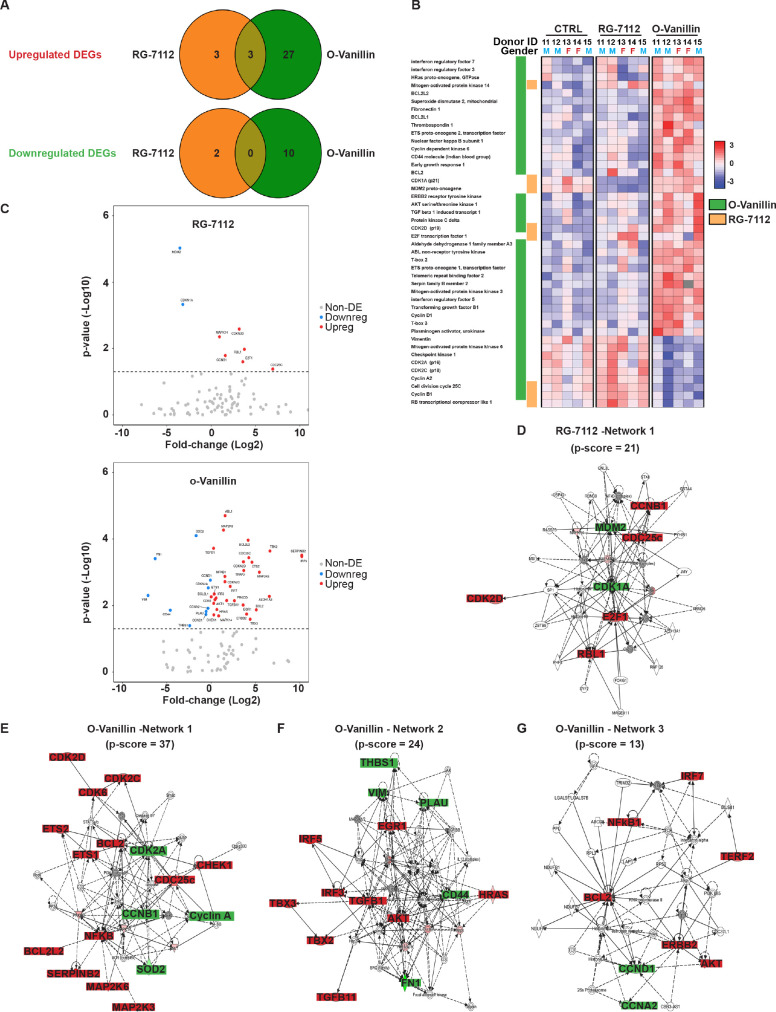
Figure 2. Differentially expressed senescence related genes in NP pellets.
(A) Venn diagrams of the differentially up and downregulated genes among the different groups. O-Vanillin, RG-7112-treated NP cells in pellets culture. For Upregulated genes odds ratio (OR) = 2.13 and p=0.39; for Downregulated genes: OR = 0 and p=1. (B) Heatmap of the top 44 over and under expressed genes in control (CTRL), RG-7112 and o-Vanillin-treated NP cells. All genes shown were first normalized to the housekeeping gene GAPDH. Data shown are relative to the calculated Z scores across the samples (see Materials and methods) and ranked by significance adjusted to p<0.05. Red represents relatively high levels of expression; blue represents relatively low levels of expression. Significantly differentially expressed genes are indicated with green lines for o-Vanillin and in orange lines for RG-7112. Each column represents one individual (for a total of n = 5 per group) and each row represents expression of a single gene. Donor ID and gender are indicated for each subject. (C) Volcano plots of mRNA expression of o-Vanillin and RG-7112 treated NP pellets: Plotted along the x-axis is the mean of log2 fold-change, along the y-axis the negative log10 of the p-values. Blue circles refer to downregulated genes, red circles refer to upregulated genes and grey circles to non-DEGs in o-Vanillin and RG-7112-treated NP pellets. The horizontal grey line is the negative logarithm of the t-test-adjusted p-value threshold (-log10 of p=0.05). (D) IPA diagrams of differentially expressed genes in RG-7112 and (E–G) o-Vanillin-treated NP pellets within the selected set of 91 genes. Direct and indirect interactions are shown by solid lines and dashed lines respectively. Green indicates gene downregulation; red depicts upregulation and molecules found by the data mining tools of IPA (build tools) are shown in gray. Color intensity represents the average of log2 fold change with brighter colors representing a more significant difference between treated and controls. Symbols for each molecule are presented according to molecular functions and type of interactions. Functional assignations attributed by IPA software. Significant difference set at p<0.05 was assessed by repeated measures Analysis of Variance (ANOVA) with Turkey’s post hoc test for multiple pairwise comparison in (B–C) and Fisher’s exact test in (A, D–G). The cells were from degenerating IVDs as indicated in Table 2.


