. 2020 Aug 21;9:e54693. doi: 10.7554/eLife.54693

Figure 3. Profile of SASP factors released from pellet cultures following senolytic treatment.

(A) Culture media was analyzed by a RayBio Human Cytokine Array. Relative mean densitometry units of the 80 factors were normalized to untreated controls with the most 25 downregulated SASP factors presented: cytokines (A–a), CC-chemokines (A–b), CXC-chemokines (A–c), growth and neurotrophic factors (A–d). Scatter plot showing the distribution in average change of 50 cytokines quantified using cytokine array (A–e). (B) Heatmap displaying quantification of 19 selected cytokines (19-plex Luminex array). Each column represents one individual (n = 5). The rows represent expression of a single protein. Data shown are log2 (fold change) relative to the average expression level in each condition. Donors ID and gender are indicated for each subject. (C) Significantly downregulated factors are presented as mean fold difference ± SEM; (n = 5). Culture media was collected from the same NP cells used in Figure 2. *Indicates significant difference assessed by repeated measures Analysis of Variance (ANOVA) with Turkey’s post hoc test for multiple pairwise comparison: p<0.05 and **indicates p<0.01.

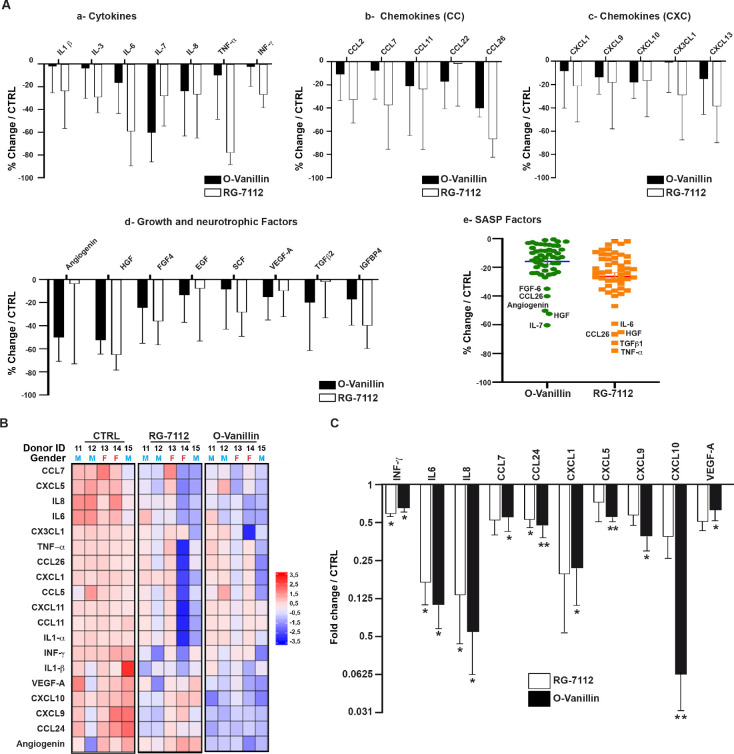
Figure 3—source data 1. Excel file containing the meausres for the selected and significantly SASPs factors measured using cytokine array and Luminex analysis in NP pellets media following the treatment with RG-7112 and o-Vanilin.

Figure 3.

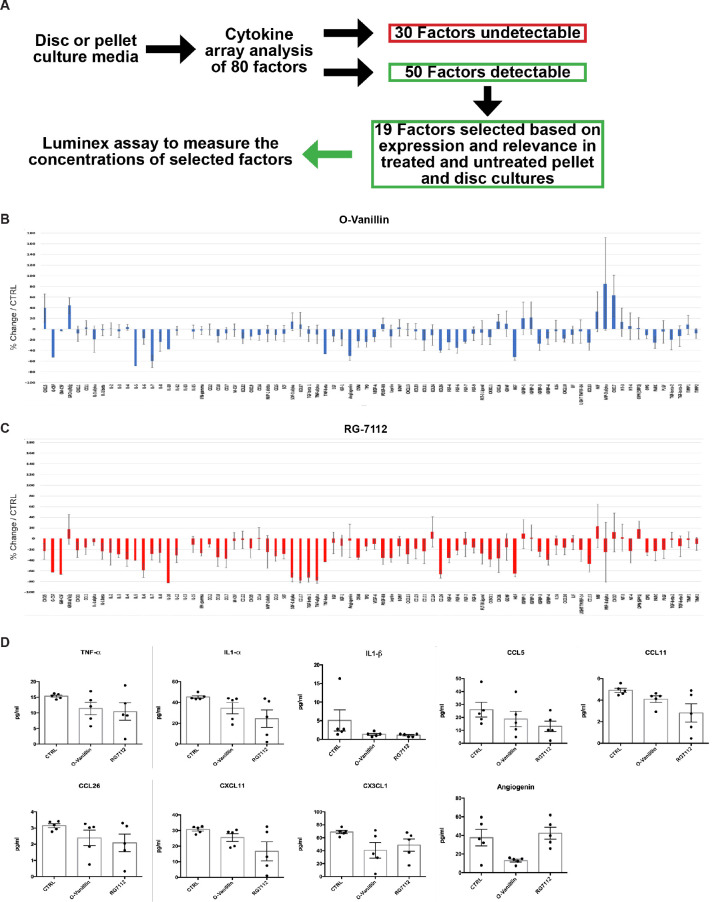
Figure 3—figure supplement 1. Total cytokine array and Luminex measures in pellet culture media.

Figure 3—figure supplement 1.

(A) Schematic representation of the media analysis by cytokine arrays and Luminex assay. Cytokine/chemokine array quantification of the media in NP cell pellets treated with (B) o-Vanillin (100 μM) and (C) RG-7112 (5 μM). Results present the percentage of change in treated compare to untreated pellet cultures. (D) Nine inflammatory factors in pellet media (TNF-α, IL-1α, IL-1β, CCL5, CCL11, CCL26, CXCL11, CX3CL1 and Angiogenin) displaying no statistically significant decrease measured by Luminex assay. Data is presented as mean ± SEM and was analyzed by repeated measures Analysis of Variance (ANOVA) with Turkey’s post hoc test for multiple pairwise comparison (n = 5).
Figure 3—figure supplement 1—source data 1. Excel file containing the complete list of SASP factors measured by cytokines arrays and the non-significantly regulated factors measured by Luminex assay in treated NP pellets media.