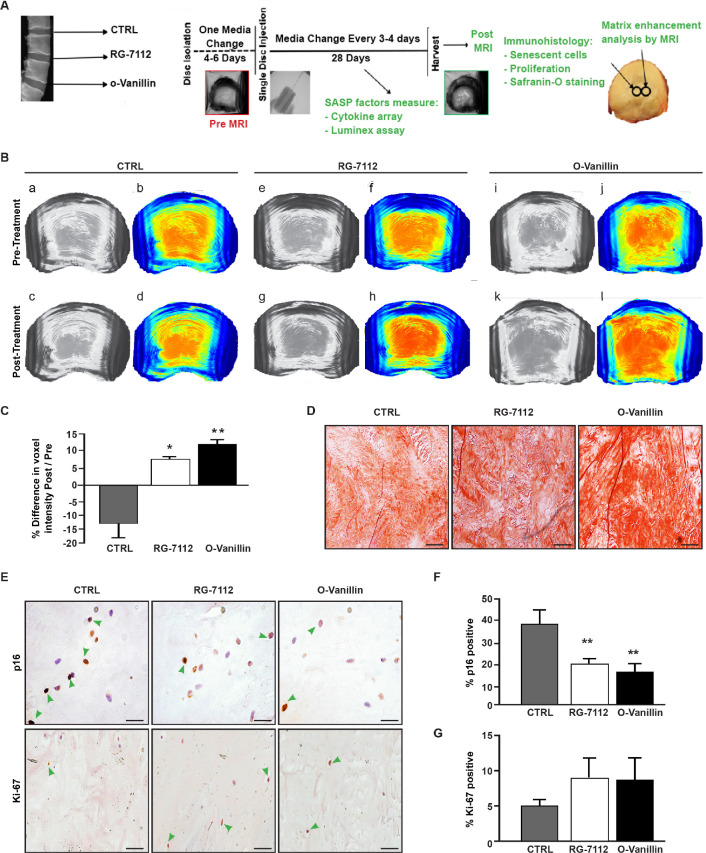
Figure 4. RG-7112 and o-Vanillin effects in ex vivo human IVD culture.
(A) Schematic of the ex vivo organ culture experiment. Lumbar spines from organ donors were assessed radiographically for signs of degeneration. Three discs per experiment were isolated from the same spine, cultured for 4–6 days then scanned with MRI and injected with vehicle, o-Vanillin or RG-7112. Discs were then cultured for an additional 28 days, with media changes every 3–4 days. The discs were scanned by MRI again at day 28. Media and tissues were used for SASP factor release and histology respectively. (B) Representative images of mid-axial T1ρ slices pre-treatment (a–b, e–f, i–j) and the same location post treatment (c–d, g–h, k–l) with vehicle (CTRL), RG-7112 (5 μM) or o-Vanillin (100 μM). The heatmap correlates the red color with the highest and the blue color with the lowest T1ρ values. (C) Quantification for NP regions with the graph showing percentage change in T1ρ values post- compared to the pre-treatment scans. (D) Representative safranin O/fast green staining of histological sections. (E) Representative images of disc sections stained with antibodies against p16INK4a and Ki-67. Quantification of (F) p16INK4a and (G) Ki-67 expression. Scale bars = 150 µm in 4D, 25 µm in 4E (p16INK4a) and 50 µm in 4E (ki-67); Error bars represent mean ± SEM, Statistical significance was assessed by two-tailed Student's t-test to compare pre and post disc groups (C) and by repeated measures Analysis of Variance (ANOVA) with Turkey’s post hoc test for multiple pairwise comparison in (F and G). *Indicates p<0.05 and **indicates p<0.01, n = 4 for each condition. The tissues were from degenerating IVDs as indicated in Tables 2 and 3.

