. 2020 Aug 7;9:e60513. doi: 10.7554/eLife.60513

Figure 1. Initial 3D classifications of the human MCU-EMRE-MICU1-MICU2 holocomplex (uniplex) in the presence and absence of Ca2+.

Numbers in parentheses denote the percentage of particles for each class. (a) The major class of particles from the uniplex sample prepared in the presence of 2 mM Ca2+. (b) Four classes of particles from the uniplex sample prepared in the absence of Ca2+ (with 2 mM EGTA).

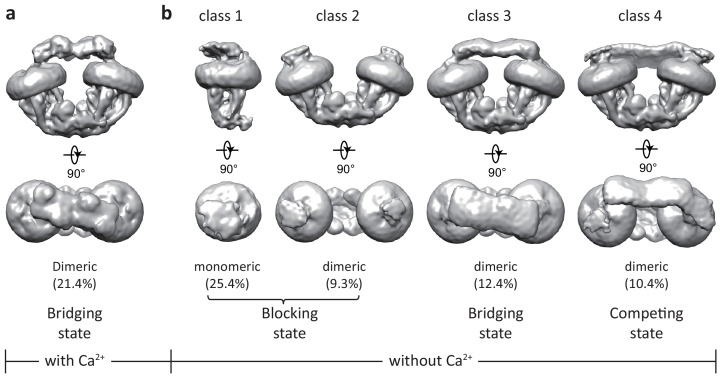
Figure 1—source data 1. Cryo-EM data collection, refinement and validation statistics.

Figure 1.

Figure 1—figure supplement 1. Structure of the MCU-EMRE subcomplex.

Figure 1—figure supplement 1.

(a) Structure of a dimeric MCU-EMRE subcomplex. Red line marks the dimerization interface. (b) Sequence and secondary structure assignment of an HsMCU subunit. (c) Sequence and secondary structure assignment of an HsEMRE subunit.
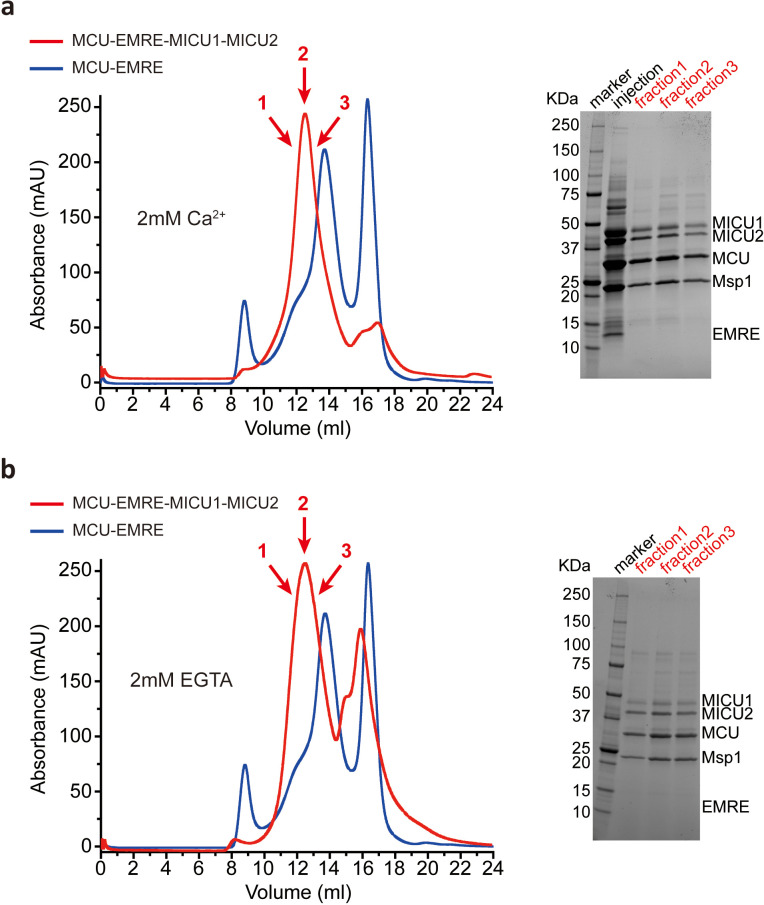
Figure 1—figure supplement 2. Purification of the human MCU-EMRE-MICU1-MICU2 holocomplex reconstituted into nanodisc.

Figure 1—figure supplement 2.

(a) SEC profile (left) of MCU-EMRE-MICU1-MICU2 holocomplex (red) reconstituted in nanodisc and purified in the presence of 2 mM Ca2+. The profile of the MCU-EMRE subcomplex in nanodisc (blue) is shown for comparison. Arrows indicate the three sample fractions shown on SDS PAGE (right). (b) SEC profile (left) and SDS PAGE (right) of the MCU-EMRE-MICU1-MICU2 holocomplex (red) reconstituted in nanodisc and purified in the absence of Ca2+ (with 2 mM EGTA).
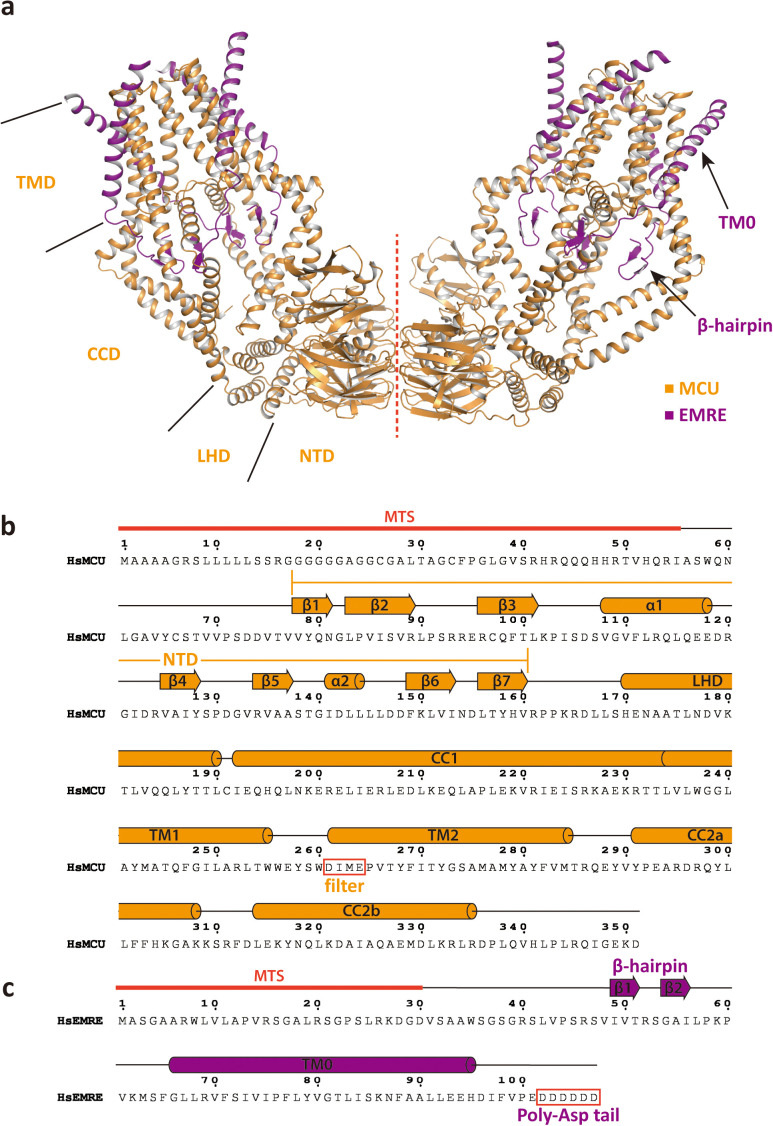
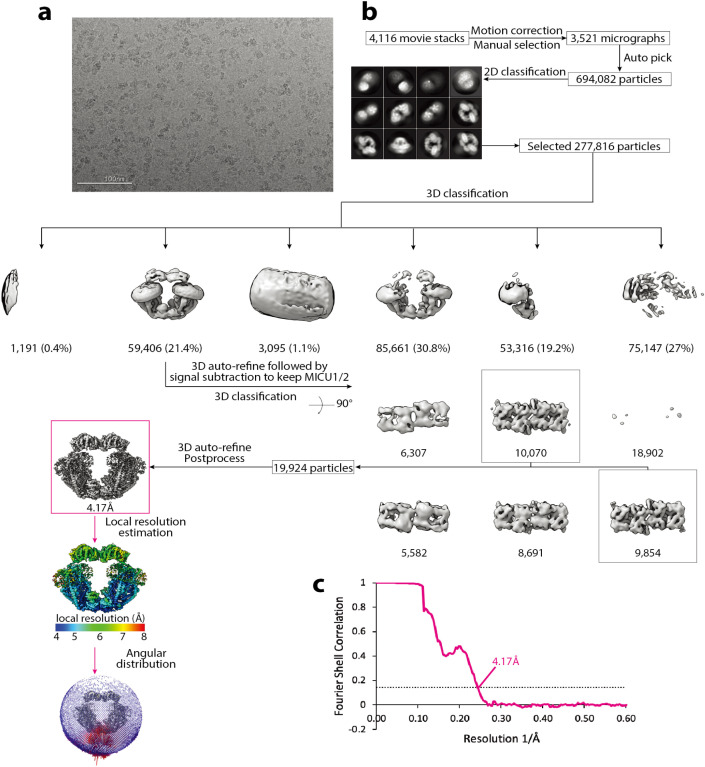
Figure 1—figure supplement 3. Cryo-EM data processing scheme of the uniplex assembly in the presence of Ca2+.

Figure 1—figure supplement 3.

(a) A representative micrograph. Scale bar is at 100 nm. (b) Flow chart of the cryo-EM data processing procedure. Selected 2D class averages are shown. The number of particles are indicated under the corresponding 3D classes with the percentage of the selected particles after 2D classification in parentheses for the first round of 3D classification. (c) Fourier Shell Correlation curves showing the overall resolution of 4.17 Å (FSC = 0.143) for the dimeric (magenta) form of the uniplex.
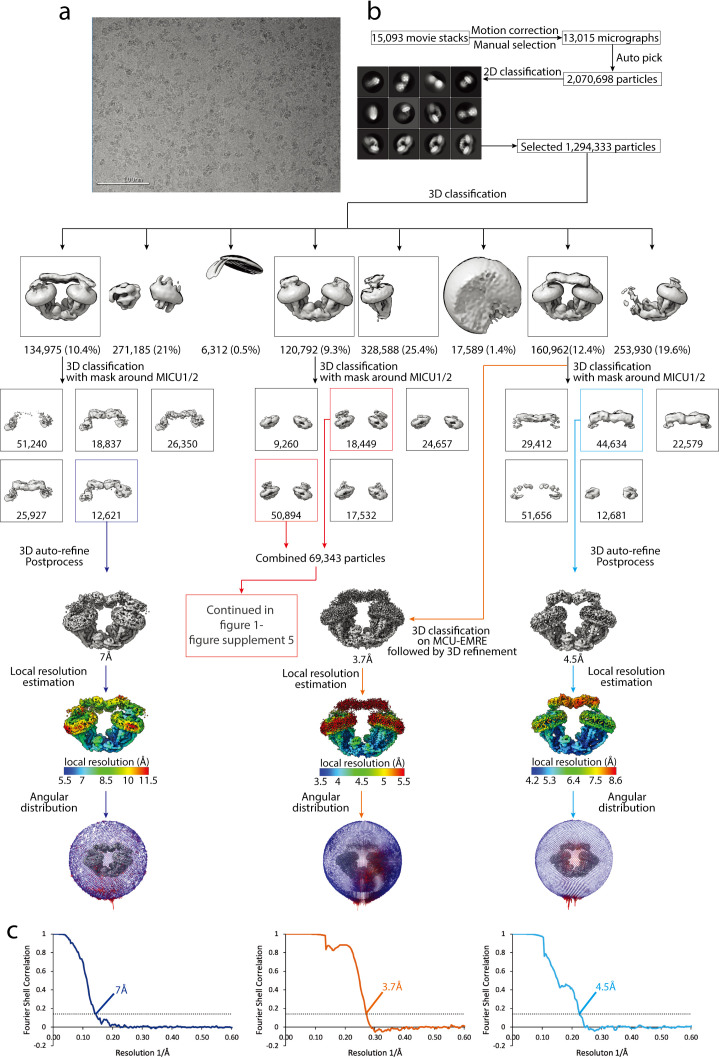
Figure 1—figure supplement 4. Cryo-EM data processing scheme of the uniplex assemblies in the absence of Ca2+.

Figure 1—figure supplement 4.

(a) A representative micrograph. Scale bar is at 100 nm. (b) Flow chart of the cryo-EM data processing procedure. Selected 2D class averages are shown. The number of particles are indicated under the corresponding 3D classes with the percentage of the selected particles after 2D classification in parentheses for the first round of 3D classification. Selected classes are indicated in colored boxes. (c) Fourier Shell Correlation curves showing the overall resolution at FSC = 0.143 for the corresponding uniplex assemblies.
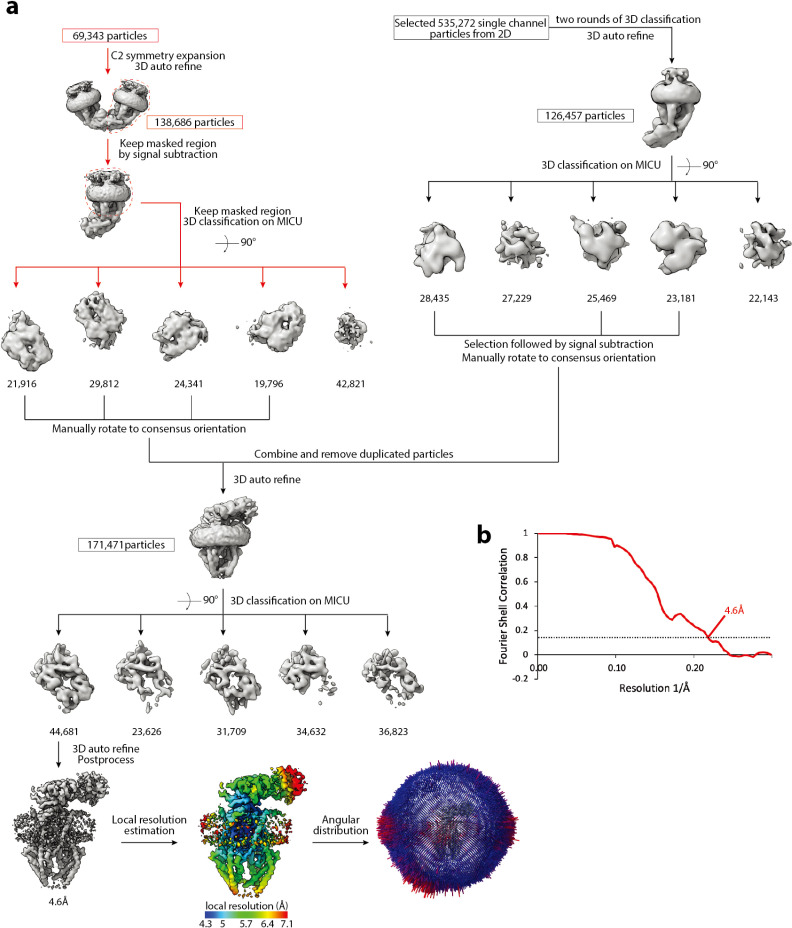
Figure 1—figure supplement 5. Cryo-EM data processing scheme of the apo blocked uniplex.

Figure 1—figure supplement 5.

(a) Flow chart of the cryo-EM data processing procedure. The particles of the dimeric uniplex were taken from Figure 1—figure supplement 4, and the particles of monomeric uniplex were re-selected from 2D class averages. Both were further classified based on the density of MICU1-MICU2 and combined. Duplicated particles were removed from the star file. The number of particles are indicated under the corresponding 3D classes. (b) Fourier Shell Correlation curve showing the overall resolution of 4.6 Å (FSC = 0.143) for the apo blocked uniplex.
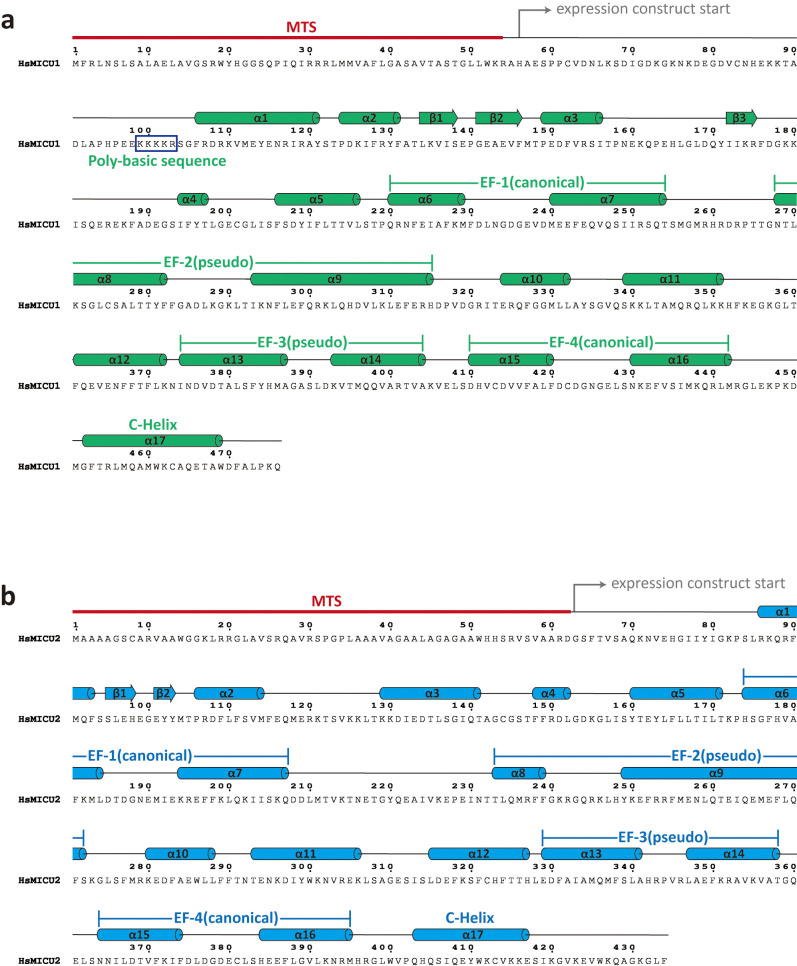
Figure 1—figure supplement 6. Sequence and secondary structure assignment of human MICU1 (upper) and MICU2 (lower).

Figure 1—figure supplement 6.