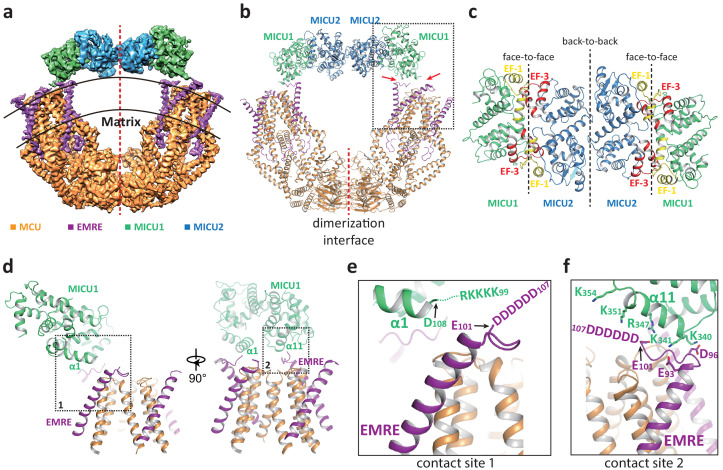
Figure 2. Structure of the MCU-EMRE-MICU1-MICU2 uniplex assembly in the presence Ca2+.
(a) Side view of the 3D reconstruction of the Ca2+-bound uniplex with each protein component individually colored. Red line marks the two-fold axis of the complex. (b) Cartoon representation of the Ca2+-bound uniplex structure. Red arrows mark the two contact sites between MICU1 and MCU/EMRE. Red line marks the dimerization interface between two MCU/EMRE subcomplexes. (c) Down view of the MICU1-MICU2 heterotetramer in cartoon representation along the two-fold axis. EF-1 and EF-3 motifs are colored in yellow and red, respectively. Dotted lines mark the interfaces between neighboring MICU subunits. (d) Protein-protein interface between the MICU1 and MCU/EMRE subcomplex (boxed area in (b)) with the two contact sites numbered and boxed. (e) Zoomed-in view of the contact site 1. In the Ca2+-bound uniplex, the structure model for MICU1 starts at D108 and the model for EMRE ends at E101. (f) Zoomed-in view of the contact site 2.


