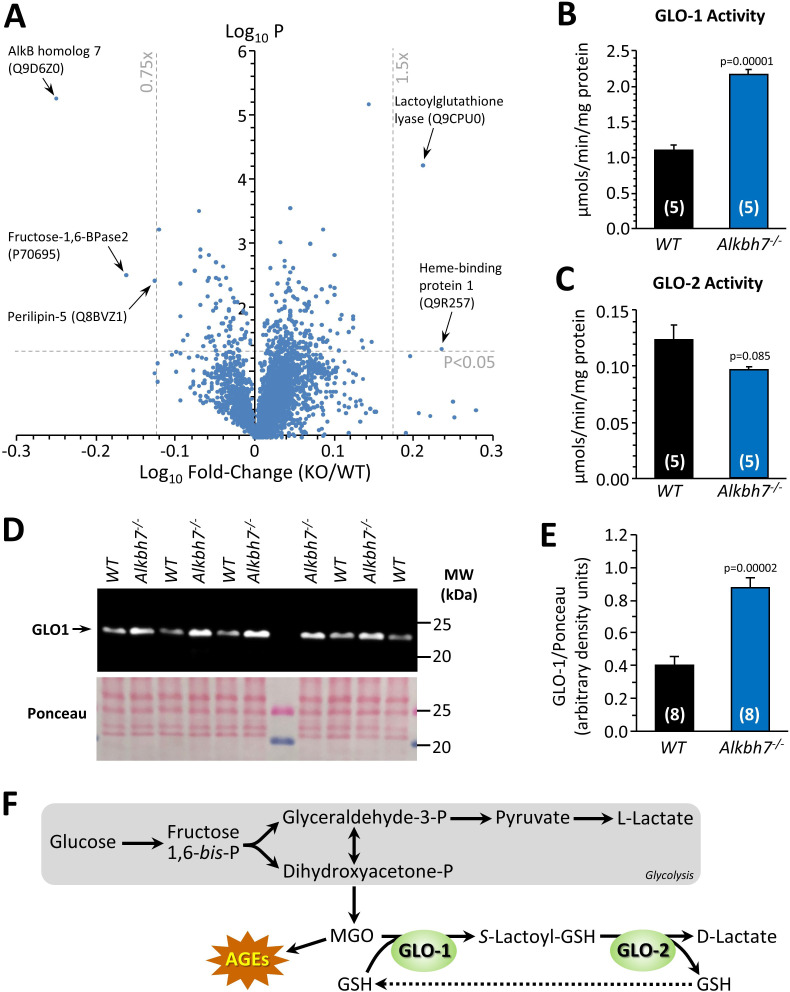
Figure 2. Proteomic analysis of protein abundance in WT vs.Alkbh7-/-.
Hearts from young male WT or Alkbh7-/- mice were analyzed by tandem mass tag LC-MS/MS as per the methods. (A) Volcano plot showing relative levels of 3737 proteins. X-axis shows Log10 of fold change (Alkbh7-/- / WT) and Y-axis shows Log10 of significance (paired t-test, N = 5). Proteins crossing thresholds (gray lines) in upper left or right quadrants are labeled. (B) Activity of GLO-1 in WT or Alkbh7-/- heart cytosol. (C) Activity of GLO-2 in WT or Alkbh7-/- heart cytosol. (D) Western blot showing abundance of GLO-1 in WT or Alkbh7-/- heart cytosol, with Ponceau stained membrane below. (E) Quantitation of GLO-1 blot, normalized to protein loading. Bar graphs in panels B/C/E show means ± SE, N = 4–5, with p-values (paired t-test) shown above error bars. (F) Schematic showing the methylglyoxal detoxification system and its relationship to glycolysis. Abbreviations: AGEs: Advanced glycation end products, GSH: glutathione. MGO: methylglyoxal. In bar graphs, N for each group is shown in parentheses.


