. 2020 Aug 14;9:e58573. doi: 10.7554/eLife.58573

Figure 5. Mitochondrial PT pore and Ca2+ handling in WT vs.Alkbh7-/-.

(A) Opening of the mitochondrial PT pore was assayed spectrophotometrically in isolated cardiac mitochondria from young male WT and Alkbh7-/- mice. Average traces are shown, with addition of 100 µM Ca2+ to initiate PT pore opening and swelling indicated by the arrow. Dotted lines indicate the presence of the PT pore inhibitor cyclosporin A (CsA). Error bars are omitted for clarity. (B) Quantitation of pore opening, as the change in swelling (absorbance at 520 nm) in 5 min. Data are means ± SE, N = 7, with significance between groups (unpaired t-test) shown above error bars. (C) Mitochondrial Ca2+ handling assayed by Ca2+ green-5N fluorescence. Isolated cardiac mitochondria from young male WT and Alkbh7-/- mice were incubated with Ca2+ green-5N to indicate extra-mitochondrial [Ca2+]. Pulses of 10 µM Ca2+ were added at ~2 min intervals as indicated by arrows. Representative traces are shown. (D) Quantitation of the number of Ca2+ pulses tolerated by mitochondria before PT pore opening occurred (as indicated by a sharp upward deflection in the Ca2+ green-5N trace). (E) Quantitation of the initial rate of mitochondrial Ca2+ uptake, calculated from the downward slope in Ca2+ green-5N fluorescence on the first 3 Ca2+ pulses. Bar graphs in panels B/D/E show means ± SE, N = 5–7, with p-values (unpaired t-test) shown above error bars. In bar graphs, N for each group is shown in parentheses.

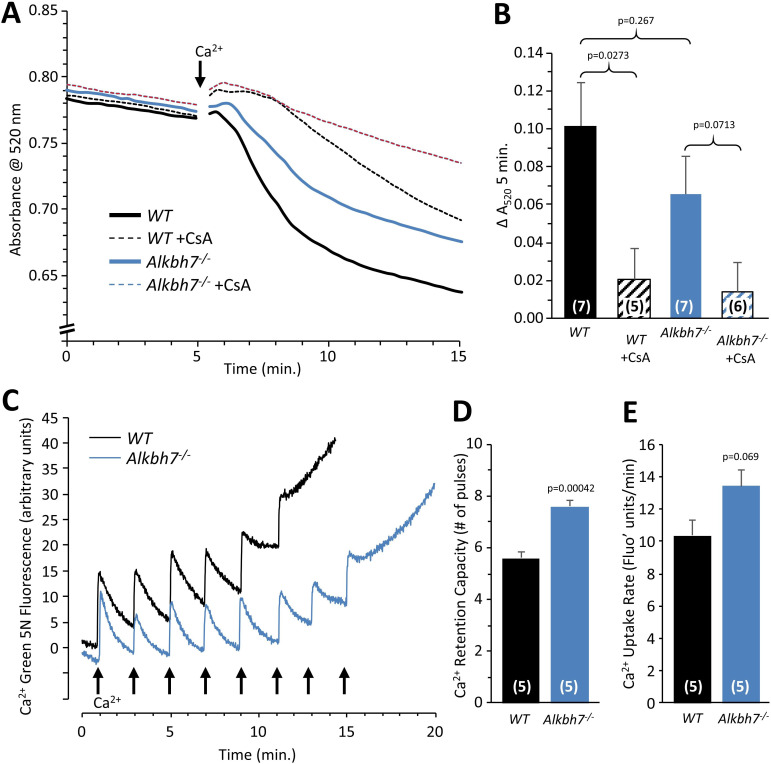
Figure 5.

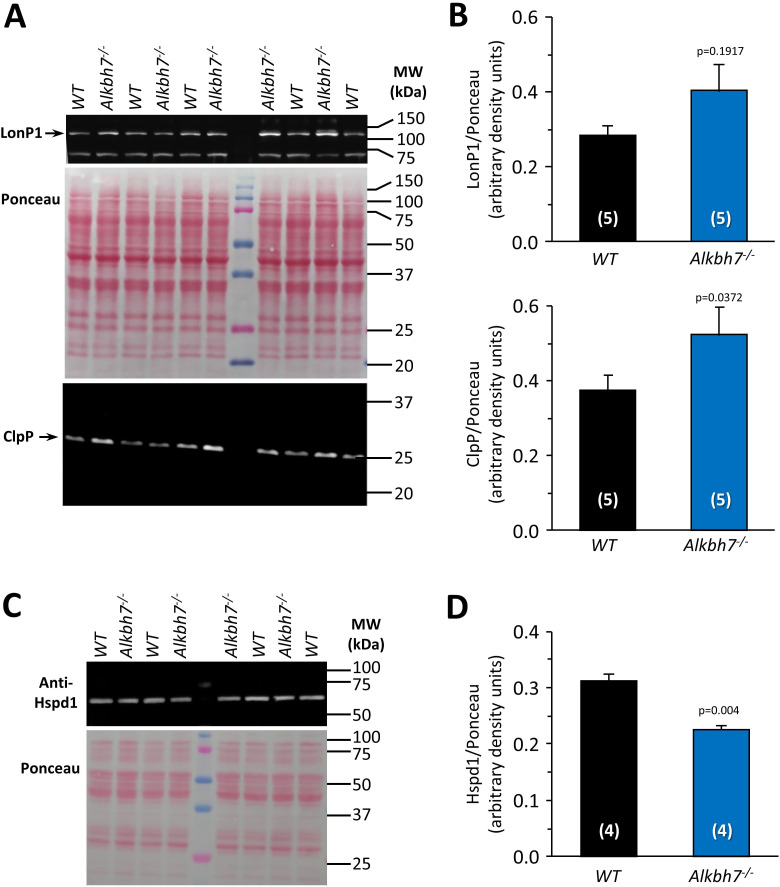
Figure 5—figure supplement 1. Western blot detection of UPRmt mediators in WT vs.Alkbh7-/-hearts.

Figure 5—figure supplement 1.

To determine whether loss of ALKBH7 resulted in activation of the mitochondrial unfolded protein response (UPRmt), the levels of key effectors were determined by western blot. (A) Blots show levels of LonP1 and Clpp in cardiac homogenate of WT and Alkbh7-/- hearts. Protein loading is shown in the central Ponceau S stained membrane. (B) Quantitation of data from blots of LonP1 and Clpp. Graphs show means ± SEM, N = 4, with p values (unpaired t-test) above the error bars. (C) Blot shows level of Hspd1 (HSP60) in mitochondria from WT and Alkbh7-/- hearts. Protein loading is shown in the Ponceau S stained membrane below. (D) Quantitation of data from blot of Hspd1. Graphs show means ± SEM, N = 4–5, with p values (unpaired t-test) above the error bars. N for each experiment shown in parentheses.
Figure 5—figure supplement 2. Cardioprotection against IR injury by dimethyl-L-2-hydroxyglutarate.

Figure 5—figure supplement 2.

Hearts from WT mice were Langendorff perfused and subjected to 25 min. ischemia plus 60 min reperfusion, with optional administration of 10 µM dimethyl-L-2-hydroxyglutarate (DM2HG) for 20 min prior to the onset of ischemia. (A) Cardiac function assessed by left ventricular balloon pressure transducer. Graph shows the product of heart rate multiplied by left ventricular developed pressure, as a percentage of the initial (pre-ischemic) value. (B) Post IR staining with TTC for quantitation of myocardial infarct size. Representative TTC-stained heart slices are shown, with pseudo-colored mask images used for quantitation by planimetry (red = live tissue, green = infarct). Data are quantified below, with individual data points to shown N, and means ± SEM. p-values (paired t-test) are shown above error bars. N for each experiment shown in parentheses.
Figure 5—figure supplement 3. Blue-native analysis of mitochondrial respiratory supercomplexes.

Figure 5—figure supplement 3.

Heart mitochondria from WT or Alkbh7-/- mice were separated by blue-native PAGE as per the methods. (A) Original gel showing positions of respiratory complexes I, V and III, and supercomplexes (SCs) at the top. Note, gel was not stained post-hoc with Coomassie blue, but gel conditions contain the dye, such that gels appear with blue bands immediately upon electrophoresis. (B) Complex V in-gel assay. White bands show lead precipitate resulting from ATPase activity of complex V. Monomeric, dimeric, and multimeric forms of complex V are indicated. Gels are representative of at least three independent experiments.