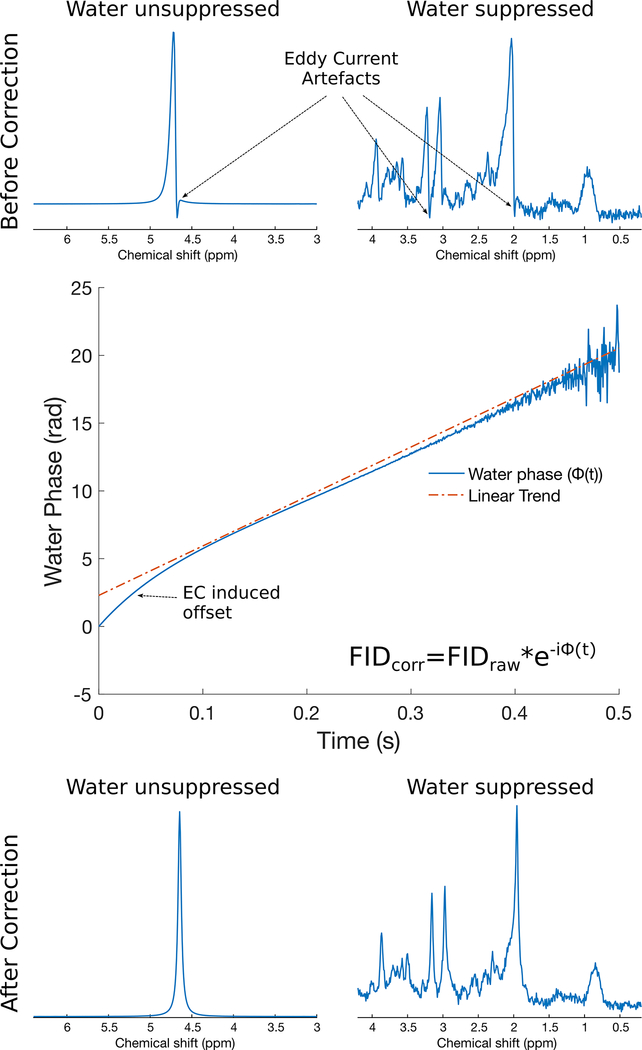
Figure 1.
Eddy current correction in synthetic 3T human brain PRESS spectra with TE=30 ms. In the top panel, water reference (left) and water suppressed (right) spectra with eddy current artefacts are shown. The central panel shows the phase evolution of the water reference FID before eddy current correction. Any deviation from linearity in this phase function is the result of the eddy current effect. The bottom panel shows the same water reference (left) and water suppressed (right) spectra following eddy current correction.

